


NZD/USD Technical ANALYSIS: BEARISH
- NZ Dollar surges above range top, hits four-month high vs. USD
- Rally now faces 28-month resistance defining dominant direction
- Weekly chart setup hints rise corrective within long-term decline
Get help building confidence in your NZD/USD strategy with our free trading guide!
The New Zealand Dollar launched sharply higher, punching through long-standing resistance in the 0.6425-41 area and even slipping past former support in the 0.6482-96 zone. That puts the currency on a collision course with trend-defining resistance set from July 2017.
The outer layer of this barrier is now at 0.6682. Breaking above that on a daily closing basis would neutralize near-term selling pressure, setting the stage for substantial upside follow-through. Short of that however, the dominant trend bias continues to favor a broadly bearish bias.
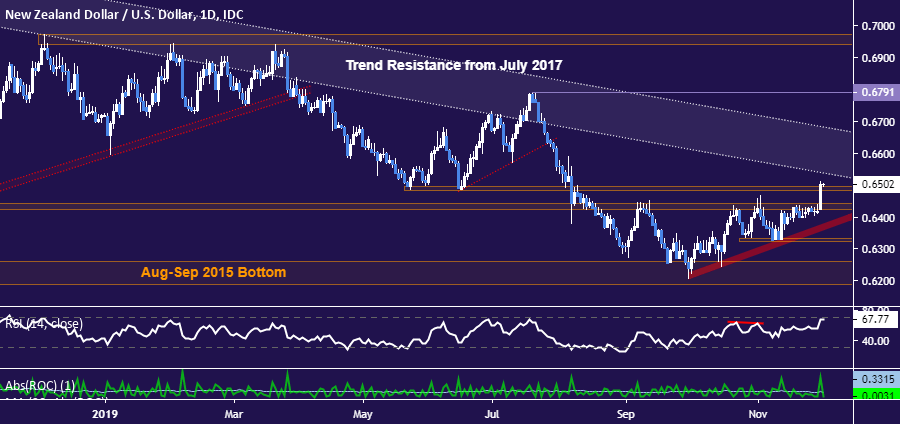
Daily NZD/USD chart created using TradingView
Zooming out to the weekly chart makes this point in more dramatic fashion, revealing that 28-month downtrend resistance is being reinforced by the underside of trend support dating back nearly two decades. It was broken in early August, in what appears to have been a tectonic bearish shift.

Weekly NZD/USD chart created using TradingView
Within this context, recent gains appear to be corrective. Indeed, if ever there was a technically well-placed point to cut off gains and trigger downtrend resumption, the region near the 0.66 figure is it. The absence of an actionable short trade signal means only time will tell if such a thing actually occurs however.
NZD/USD TRADING RESOURCES:
- Just getting started? See our beginners’ guide for FX traders
- Having trouble with your strategy? Here’s the #1 mistake that traders make
- Join a free live webinar and have your trading questions answered
--- Written by Ilya Spivak, Currency Strategist for DailyFX.com
To contact Ilya, use the Comments section below or @IlyaSpivak on Twitter


