


NZD/USD Technical ANALYSIS: BEARISH
- New Zealand Dollar launched a rebound after hitting four-year lows
- Spirited gains nevertheless look corrective within broader down move
- Monthly chart points to long term, structural bearish trend reversal
Get help building confidence in your NZD/USD strategy with our free trading guide!
The New Zealand Dollar has launched a spirited recovery after finding a bottom just above support marking the August to September 2015 bottom. Prices are on pace to score the fourth consecutive day of gains, marking the longest winning streak in two months.
Support-turned-resistance at 0.6425 (October 2018 low) marks the first upside hurdle. A daily close above that targets another former support level in the 0.6482-96 area. Neutralizing the broader downtrend calls for a greater feat however: a push above downward-sloping resistance from July 2017 (now at 0.6766).
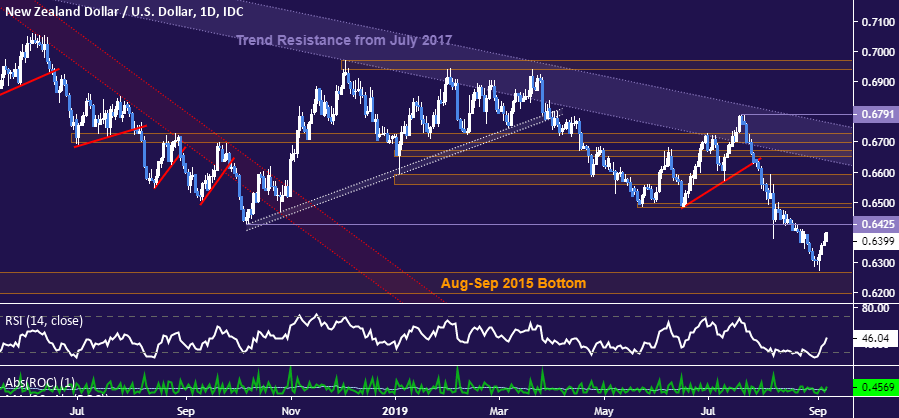
NZD/USD daily chart created using TradingView
That suggests the recent rise is well within the bounds of a correction, whereas the dominant bias remains bearish. The monthly chart reinforces this view. It reveals that August ended with a break of support guiding NZD/USD higher for nearly two decades, flagging a structural, long-term trend change underway.
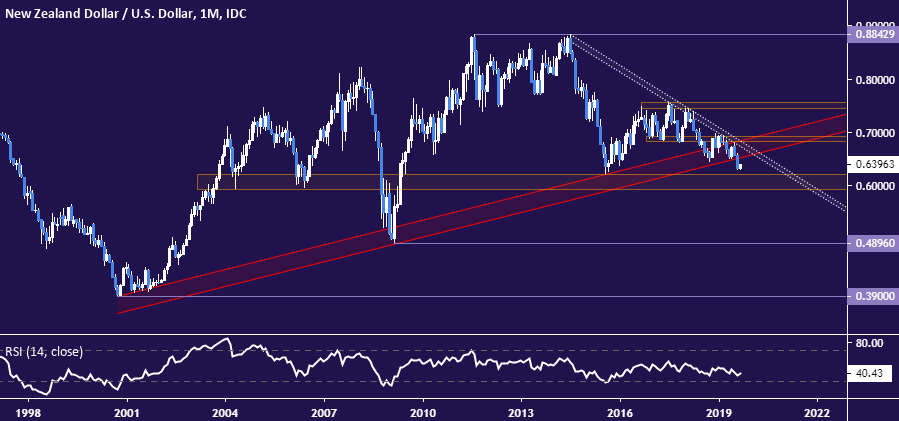
NZD/USD monthly chart created using TradingView
NZD/USD TRADING RESOURCES:
- Just getting started? See our beginners’ guide for FX traders
- Having trouble with your strategy? Here’s the #1 mistake that traders make
- Join a free live webinar and have your trading questions answered
--- Written by Ilya Spivak, Currency Strategist for DailyFX.com
To contact Ilya, use the Comments section below or @IlyaSpivak on Twitter


