


NZDUSD Technical Strategy: BEARISH
- NZD rebound stalling ahead of dense resistance bloc around 0.67 figure
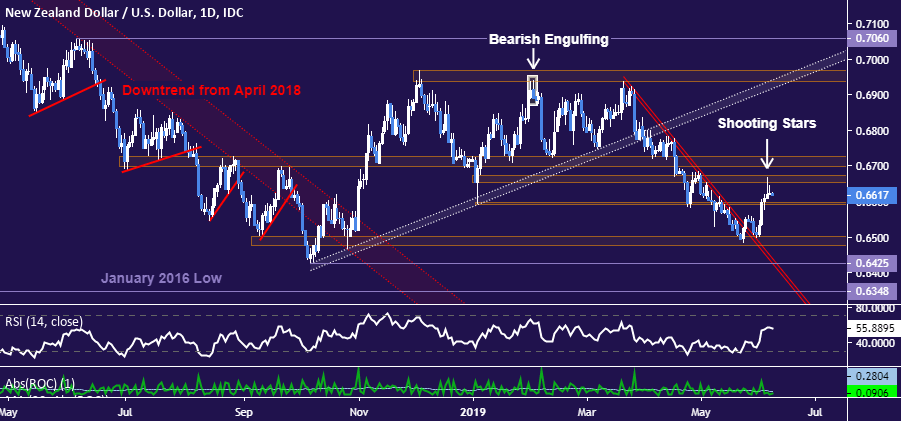
- Shooting Star candles, near-term trend line break argue for bearish bias
- Critical support remains near 0.65, resistance running through 0.6727
See our free trading guide to help build confidence in your NZDUSD trading strategy !
The New Zealand Dollar rebounded after finding support near the 0.65 figure against its US counterpart, breaking the bounds of the downtrend from late-March highs. A pair of dramatic-looking Shooting Star candlesticks ahead of a dense resistance bloc running through 0.6727 hints upside momentum is fading however, suggesting sellers may soon retake the initiative.
In fact, zooming in to the four-hour chart for a sense of near-term positioning, it seems like a bearish reversal may be in the works already. NZDUSD looks to have broken support guiding it higher over the past week, painting that rise as corrective and suggesting the longer-term decline is back in play. A push below immediate support in the 0.6559-78 area is likely to expose recent lows near the 0.65 once again.

NZDUSD TRADING RESOURCES:
- Just getting started? See our beginners’ guide for FX traders
- Having trouble with your strategy? Here’s the #1 mistake that traders make
- Join a free live webinar and have your trading questions answered
--- Written by Ilya Spivak, Currency Strategist for DailyFX.com
To contact Ilya, use the Comments section below or @IlyaSpivak on Twitter


