


NZD/USD Technical Strategy: BEARISH
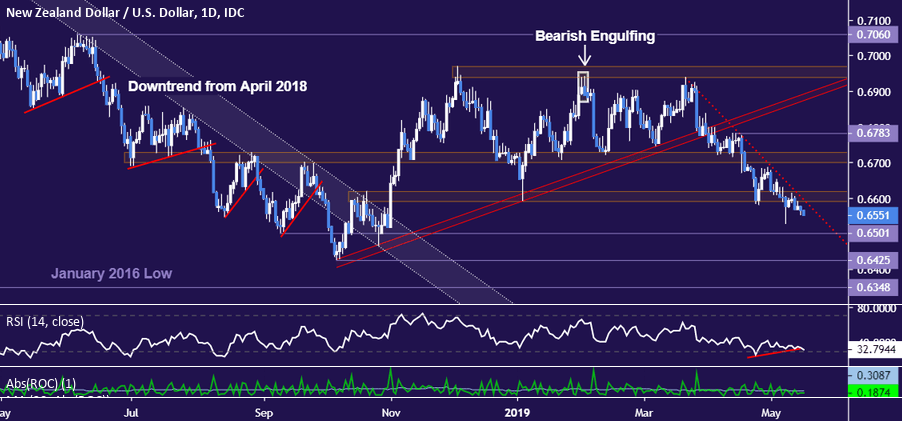
- NZD poised to test 0.65 vs. USD after breaking chart support barrier
- Positive RSI divergence calls for caution on downside follow-through
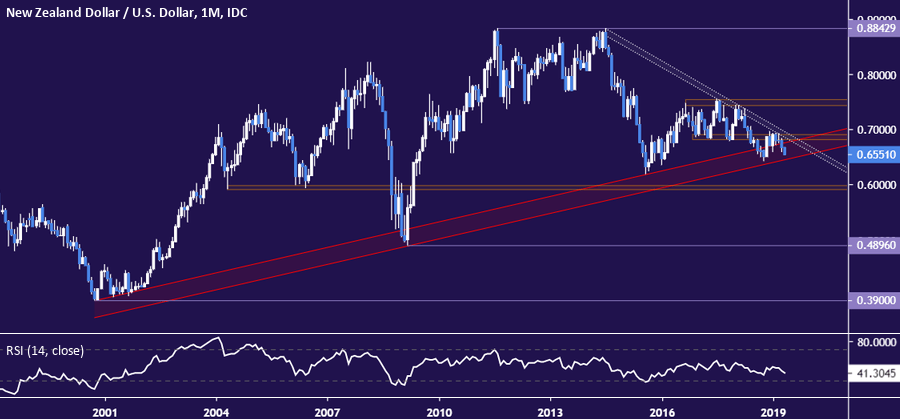
- Monthly chart reveals prices at decisive pivot for the long-term trend
See our free trading guide to help build confidence in your NZD/USD trading strategy !
The New Zealand Dollar looks poised to challenge the 0.65 figure against its US namesake after prices broke below support in the 0.6591-0.6619 area. A daily close below this barrier would open the door for a challenge of the October 2018 swing bottom at 0.6425.
Early signs of positive RSI divergence are a worrying sign of sellers however, warning that downside momentum may be ebbing. This might merely imply consolidation before further weakness, but it may also precede a reversal higher.
A daily close back above 0.6619 would invalidate the latest support break and neutralize the downtrend from the March 21 high. From there, the door may be opened for move back above the 0.67 figure to retest former support in the 0.6699-0.6727 zone.
Seeing a bit of indecision near current levels is not surprising once zooming back to a monthly chart reveals prices to be sitting squarely atop 18-year rising trend support (now at 0.6476). Finishing the month below it would mark a major reversal, putting the 0.60 level into focus longer term.
Resistance defining the longer-term bearish bias is also uncomfortably close for the bears’ comfort, making this a decisive moment. That is now at 0.6974. A breach above this threshold on a monthly closing basis may set the stage for a lasting recovery over the subsequent weeks and months.
NZD/USD TRADING RESOURCES:
- Just getting started? See our beginners’ guide for FX traders
- Having trouble with your strategy? Here’s the #1 mistake that traders make
- Join a free Trading Q&A webinar and have your questions answered
--- Written by Ilya Spivak, Currency Strategist for DailyFX.com
To contact Ilya, use the Comments section below or @IlyaSpivak on Twitter


