


NZD/USD Technical Strategy: BEARISH
- NZ Dollardeclines for five consecutive days, stalls above 0.67 figure
- Break of counter-trend support line hints bearish trend has resumed
- January lows in focus if sellers can manage daily close below 0.6686
See our free trading guide to help build confidence in your NZD/USD trading strategy !
A New Zealand Dollar upswing triggered by better-than-expected local CPI data was conspicuously rejected at trend line resistance guiding the move lower since early December. Sellers now look poised to challenge support in the 0.6686-0.6713 area again, with a break below that exposing the 0.6592-0.6619 zone.
Trend line resistance is now at 0.6817. A reversal above that confirmed on a daily closing basis may neutralize near-term selling pressure and open the door for a test of the 0.6849-84 region. That is followed by the December 4 swing high at 0.6969.
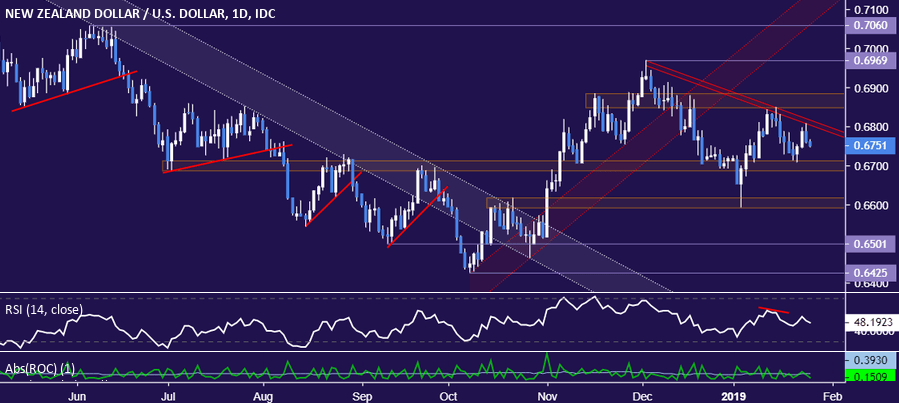
On balance, the path of least resistance still looks to favor the downside, with overall positioning pointing to resumption of the April-October 2018 decline following a corrective rise over the subsequent two months. If oncoming weakness takes prices below 18-year trend support, a structural reversal may be confirmed.

NZD/USD TRADING RESOURCES:
- Just getting started? See our beginners’ guide for FX traders
- Having trouble with your strategy? Here’s the #1 mistake that traders make
- Join a free Trading Q&A webinar and have your questions answered
--- Written by Ilya Spivak, Currency Strategist for DailyFX.com
To contact Ilya, use the Comments section below or @IlyaSpivak on Twitter


