


NZD/USD Technical Strategy: FLAT
- New Zealand Dollar testing range support in play since December 2016
- Short-term positioning hints at downside bias but confirmation is absent
- Waiting for better-defined setup seems wise before committing to a trade
See our free trading guide to help build confidence in your NZD/USD trading strategy !
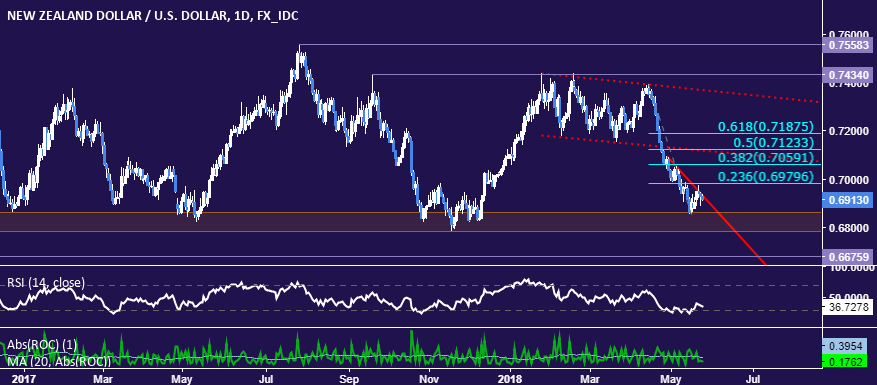
The New Zealand has dropped to test support at the bottom of a range that has contained the currency’s moves against its US counterpart since December 2016. While this has proven to be the launch pad for significant forays to the upside however, the bounds of the near-term uptrend remain intact for now.
Range support stands in the 0.6781-0.6862 area. A break below its lower boundary may suggest the long-term down trend started from highs set in July 2014 is resuming. Alternatively, a daily close above falling trend line resistance at 0.6931 might precede an upswing akin to those launched in May and November 2017.
Turning to the four-hour chart, it looks like the latest down leg started in late April has given way to a corrective upswing. The move higher has traced out a Flag chart pattern, a setup typically indicative of forthcoming trend continuation. In this case, that carries bearish implications.
Still, an actionable short trade setup needs confirmation on a break below the Flag’s lower boundary. Alternatively, a breach above the 0.70 figure would invalidate that read on price positioning, suggesting that something more substantive than a brief upside retracement is in the works.

On balance, this makes for an inconclusive setup. The downside scenario is perhaps a bit more probable but taking a trade one way or another seems premature until positioning producers a more explicit trigger. In the meantime, standing aside seems most prudent.
NZD/USD TRADING RESOURCES
- Just getting started? See our beginners’ guide for FX traders
- Having trouble with your strategy? Here’s the #1 mistake that traders make
- Join a free Trading Q&A webinar and have your questions answered
--- Written by Ilya Spivak, Currency Strategist for DailyFX.com
To contact Ilya, use the Comments section below or @IlyaSpivak on Twitter


