To receive Ilya's analysis directly via email, please SIGN UP HERE
Talking Points:
- NZD/USD Technical Strategy: Flat
- Kiwi Dollar breaks three-day win streak, forms bearish candlestick pattern
- Waiting for acceptable risk/reward parameters to establish short position
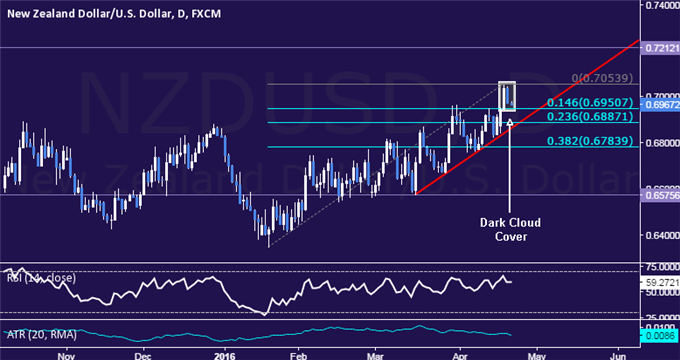
The New Zealand Dollar found resistance below the 0.71 figure, breaking a three-day winning streak against its US namesake. Prices have formed a bearish Dark Cloud Cover candlestick pattern, hinting a larger top may be taking shape.
Near-term support is at 0.6951, the 14.6% Fibonacci retracement. A break below that on a daily closing basis opens the door for a test of 0.6887, the intersection of the 23.6% level and a rising trend line. Alternatively, a push above the April 19 high at 0.7054 paves the way for a challenge of support-turned-resistance at 0.7212.
We are keen to enter short NZD/USD in line with our 2016 fundamental outlook. However, prices are too close to near-term support to justify entering short from a risk/reward perspective. With that in mind, we will continue to stand aside and wait for a better-defined opportunity to present itself.
Are you making this common mistake trading NZD/USD? Find out here !