


To receive Ilya's analysis directly via email, please SIGN UP HERE
Talking Points:
- NZD/USD Technical Strategy: Flat
- Support: 0.7597, 0.7494, 0.7406
- Resistance:0.7700, 0.7828, 0.8034
The New Zealand Dollar may have marked a significant reversal against its US namesake after prices cleared resistance capping gains since October 2014. A daily close above the 61.8% Fibonacci retracement at 0.7700 exposes the 76.4% level at 0.7828. Alternatively, a reversal below 0.7597 (50% Fib, trend line resistance-turned-support) clears the way for a challenge of the 38.2% level at 0.7494.
Our short NZDUSD position was stopped out on a daily close above 0.7608. From here, risk/reward considerations argue against entering long with prices in close proximity to resistance. On the other hand, the absence of a defined bearish reversal signal suggests taking up the short side is premature. We will remain flat for now.
Add these technical levels directly to your charts with our Support/Resistance Wizard app!
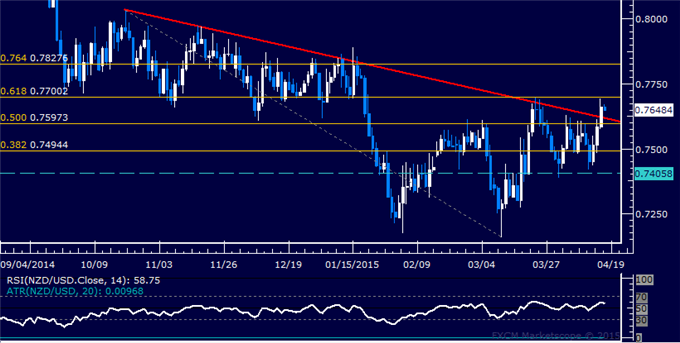
Daily Chart - Created Using FXCM Marketscope
--- Written by Ilya Spivak, Currency Strategist for DailyFX.com


