Nikkei 225 Technical Analysis Talking Points:
- The long daily chart uptrend is still very much in place
- However, gains do look a bit overextended
- A rest may be needed before the next important top can be durably beaten
Get trading hints and join our analysts for interactive live coverage of all major economic data at the DailyFX Webinars.
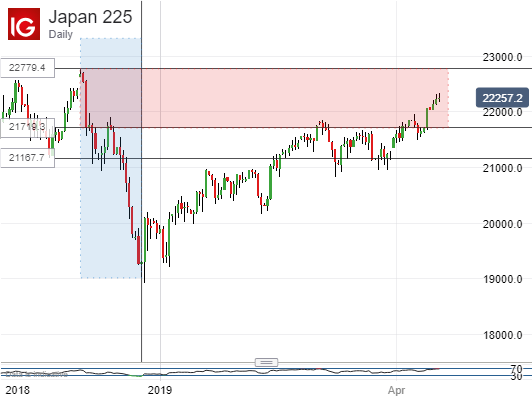
The Nikkei 225 has returned to more obviously bullish ways this week after a period of range trading which characterized trade since the middle of February.
The Tokyo blue-chip benchmark has logged an impressive run of gains since April 12 which have taken it back up to highs not seen since December 6.

The index is now comfortable above its former range top, which came in at 21,719.3. That was actually the bottom of the very sharp one-day fall which occurred on December 4, after the Dow dropped by nearly 800 points on worries about US/China trade relations. We might note in passing that those worries remain very much with us.
Anyway, that December fall marked the top of a broader slump which took the Nikkei 225 all the way down to the lows plumbed later that month. Those briefly took the index below 19,000 points.
Since then the index has gradually but doggedly replaced that fall and we are now at the point where more than 80% of it has been clawed back. Given all the fundamental uncertainties around that’s quite a show of resilience.
Sights are now on complete negation of that fall, but that won’t be seen until the index is durably back above the top of its current range which comes in at 22,779.
With this year’s long uptrend still very much intact (the current channel bottom is more than 1000 points below the market), there’s every chance that the bulls will reach this milestone. However the index does unsurprisingly look rather overbought via most momentum indicators and this week could yet see some consolidation.
If that takes the benchmark no lower than the 21,867 region, then the bulls should have little cause for alarm. That region was where trade concentrated in early April and late March and it should hold any near-term falls providing there’s no general loss of risk appetite.
However, slips below that might see that uptrend channel under more threat and should probably result in a much more cautiously bullish approach to trading.
Resources for Traders
Whether you’re new to trading or an old hand DailyFX has plenty of resources to help you. There’s our trading sentiment indicator which shows you live how IG clients are positioned right now. We also hold educational and analytical webinars and offer trading guides, with one specifically aimed at those new to foreign exchange markets. There’s also a Bitcoin guide. Be sure to make the most of them all. They were written by our seasoned trading experts and they’re all free.
--- Written by David Cottle, DailyFX Research
Follow David on Twitter @DavidCottleFX or use the Comments section below to get in touch!


