Nikkei 225 Technical Analysis Talking Points:
- This year’s dominant uptrend channel has been cracked
- The break may not yet be completely conclusive, but it should clearly worry bulls
- They’ll need to reverse it very quickly
Get trading hints and join our analysts for interactive live coverage of all major economic data at the DailyFX Webinars.
From a technical perspective the Nikkei 225 is now at an interesting juncture, and possibly a disturbing one for those still on the bullish side.
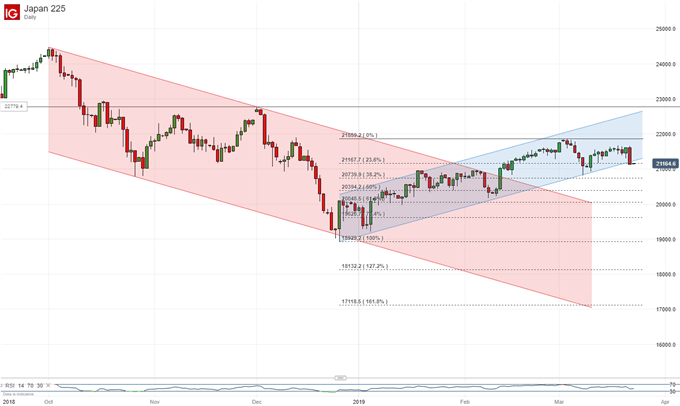
The Tokyo equity benchmark’s daily chart clearly shows that the strong uptrend channel from late December last year has now been broken to the downside. Friday’s daily close was the first outside it in the channel’s history.

As you can see from the chart above the index’s slide was arrested around the first, 23.6% Fibonacci retracement of this year’s rise. That comes in at 21167 or so and, while the index holds around this level then it will probably remain a possibility that the uptrend can get back on track. It had been in place for some time and has not yet broken very conclusively. However further falls from here and more daily or weekly closes below the line will obviously present the bulls with a problem.
Support is likely quite strong between the next two Fibonacci levels. They come in at 20739 and 20394, but by the time we get to those levels that uptrend channel will be ancient history and the market will then probably be focused rather on the daily chart downtrend from October last year.
That trend was broken by 2019’s gains, but a return now looks at least possible if current, near-term support can’t hold. A slide back to those lower retracement levels would also entail the psychological blow of losing that reasuring 21000 handle.
In short this is probably a time for caution and for trading strategies which can tolerate further falls. The bulls may yet be able to rescue this year’s dominant uptrend but, if they can, they haven’t got long to make their moves.
Resources for Traders
Whether you’re new to trading or an old hand DailyFX has plenty of resources to help you. There’s our trading sentiment indicator which shows you live how IG clients are positioned right now. We also hold educational and analytical webinars and offer trading guides, with one specifically aimed at those new to foreign exchange markets. There’s also a Bitcoin guide. Be sure to make the most of them all. They were written by our seasoned trading experts and they’re all free.
--- Written by David Cottle, DailyFX Research
Follow David on Twitter @DavidCottleFX or use the Comments section below to get in touch!


