


Nikkei 225 Technical Analysis Talking Points:
- The Nikkei’s uptrend is still with us
- But it hasn’t been tested to the upside for a while
- Key support is now in focus and its fate will be important
Get trading hints and join our analysts for interactive live coverage of all major economic data at the DailyFX Webinars.
The Nikkei 225 remains well within the uptrend which has dominated 2019’s trade, but some more worrying signs are appearing for the bulls who’ve had things very much their own way so far. Perhaps they should not get too comfortable.
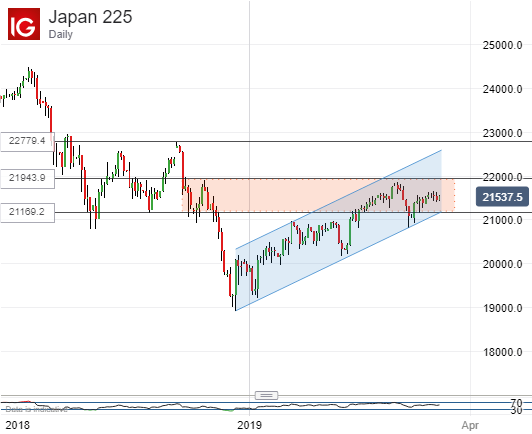
For, although that uptrend channel certainly holds good, the Nikkei has spent much of the last two weeks closer to the channel bottom than the top. Indeed, the top hasn’t faced a serious test since early March. That rest resulted in the last significant top (March 4’s 21846), but the bullish impulse was turned well before it got to the channel top.
And that’s a problem for the bulls because they will need to make the index much more comfortable within its current range than it looks so far if they are to push on much further.
That range comes in between 21169 and 21943. It formerly bounded trade between early and mid-December last year, immediately before the slide down to the lows at which the index started the year.
The base of that range should probably now be regarded as important near-term support and, indeed it is notable that it comes in within a couple of points of the first, 23.6% Fibonacci retracement of this year’s rise. It’s also some way below a current market marked with rather small daily ranges. Still, it’s probably worth playing both the range and the channel for as long as that support holds.
To the upside the range top of 21943 probably provides the most obvious near-term daily-chart resistance point. However, the bulls also have to surmount and look comfortable near that March peak of 21846 if their long run is not to start looking a little exhausted.
Resources for Traders
Whether you are new to trading or an old hand DailyFX has plenty of resources to help you out. There is our trading sentiment indicator which shows you live how IG clients are positioned right now. We also hold educational and analytical webinars and offer trading guides, with one specifically aimed at those new to foreign exchange markets. There’s also a Bitcoin guide. Be sure to make the most of them all. They were written by our seasoned trading experts and they’re all free.
--- Written by David Cottle, DailyFX Research
Follow David on Twitter @DavidCottleFX or use the Comments section below to get in touch!


