


Nikkei 225 Technical Analysis
- Nikkei 225 near-term uptrend facing next critical headwind after resistance held
- The index created a rising wedge which is typically a bearish reversal formation
- Near-term support is at 20,347 with range resistance between 20,950 and 21,035
Find out what equities could face in the First quarter via our most recent forecasts in the DailyFX Trading Guides page
After finding a bottom around the September 2017 lows last month, the Nikkei 225 has rallied over 8 percent. In its near-term uptrend, prices stopped short of a horizontal range of former support between 20,950 and 21,035. This area consists of lows achieved in February, March, October and December 2018. It also appears to have reinstated itself as resistance and thus presents itself as a headwind for gains.
There is a sign that the Nikkei 225 may be readying to turn lower and resume the dominant downtrend from October. On the daily chart below, the index has formed a rising wedge showing that as prices climbed, the trading range narrowed. This is typically seen as a reversal pattern. A close under the rising support line of the wedge could be the beginning of a turn lower.
As per the usual, confirmation would further support this argument. Immediate support is the March 2018 low at 20,347. Descending through it exposes September 2017 lows just below 19,239. Should the Nikkei 225 proceed higher otherwise, a push above resistance exposes 21,851. Beyond that lies the November and December 2018 highs between 22,486 and 22,698.
Nikkei 225 Daily Chart
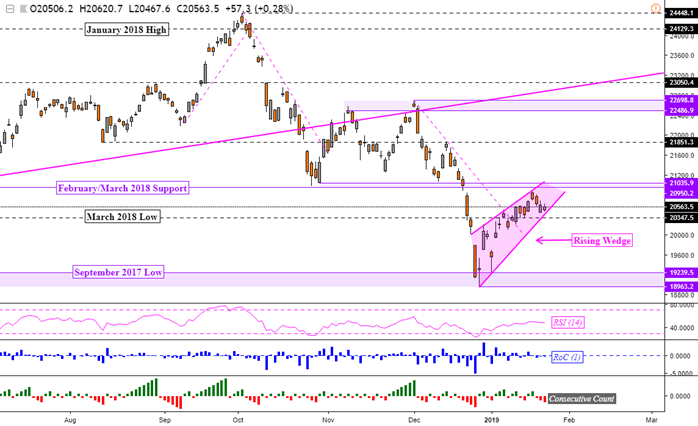
Chart created in TradingView
Nikkei 225 Trading Resources:
- Join a free Q&A webinar and have your trading questions answered
- Having trouble with your strategy? Here’s the #1 mistake that traders make
- See how equities are viewed by the trading community at the DailyFX Sentiment Page
--- Written by Daniel Dubrovsky, Junior Currency Analyst for DailyFX.com
To contact Daniel, use the comments section below or @ddubrovskyFX on Twitter


