


Nikkei 225 Technical Analysis Talking Points:
- The index has retreated back into an important support zone
- However it has only crept in and its tenure there is not assured
- Watch the next few daily closes carefully
Get trading hints and join our analysts for interactive live coverage of all major economic data at the DailyFX Webinars.
Many global indexes have been hard hit by waning risk aversion and the Nikkei 225 has not escaped. Indeed, the Tokyo stock benchmark has now slipped back into a key support zone whose fate will be well worth watching.
That zone comes in between 20,825.3 the low point of October’s trading and 20,282.9, March and 2018’s low point.
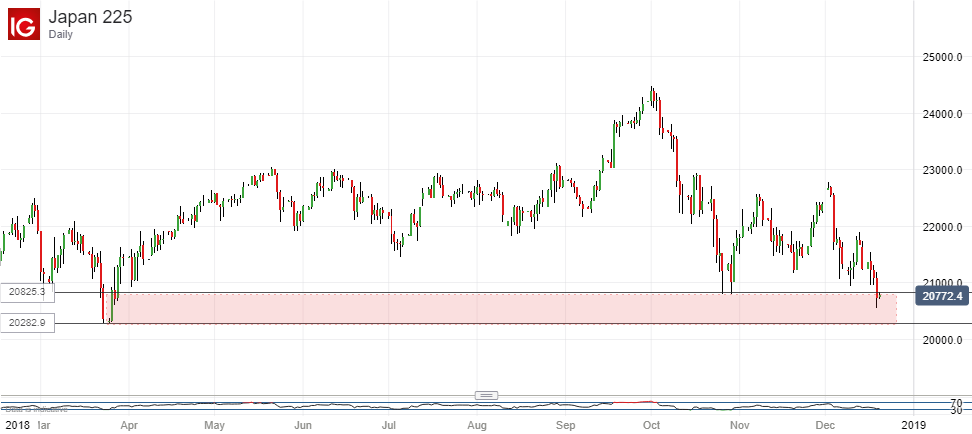
The upper limit of the support zone coincides more or less exactly with the second, 38.2% Fibonacci retracement of the rise up to this year’s highs from the lows of June 26. The index has yet to stage a conclusive break of this level, and remains very close to it, as can be seen from the chart above.
If we do see it break on a daily or weekly closing basis then a test of the support band’s lower bounds can be expected, with new lows for this year beckoning below.
However, markets are likely to soon thin out for the holiday break so, for the uncommitted, now might not be the time to get involved at all.
That said the bears remain clearly in charge at present, with their position only boosted by the slide below October’s lows. If the bulls can’t get the index back above this support zone then the Nikkei will remain an index to play from the short side.
Likely targets below current support will probably include the 20,288 level around which the index hovered between June and August 2017 and 19,073 where the bears were held at bay on August 25 of that year. Of course the psychological impact of any sustained fall below 20,000 may be considerable. The Nikkei 225 has not been seen below that point since mid-September, 2017.
Resources for Traders
Whether you are new to trading or an experienced old hand DailyFX has plenty of resources to help you get better. There is our trading sentiment indicator which shows you live how IG clients are positioned right now. We also hold educational and analytical webinars and offer trading guides, with one specifically aimed at those new to foreign exchange markets. There’s also a Bitcoin guide. Be sure to make the most of them all. They were written by our seasoned trading experts and they are all free.
--- Written by David Cottle, DailyFX Research
Follow David on Twitter @DavidCottleFX or use the Comments section below to get in touch!


