


Nikkei 225 Technical Analysis Talking Points:
- The Nikkei 225 has slipped sharply this week
- It has moved further away from what now looks like a key resistance zone
- Its short-term daily chart uptrend has held
Get trading hints and join our analysts for interactive live coverage of all major economic data at the DailyFX Webinars.
The Nikkei 225 has shared fully in the recent bout of risk aversion which has seen stock markets swoon around the world.
Technically speaking, however, the Tokyo stock benchmark has now retreated even further away from what looks like a key resistance zone. That comes in between November 7’s high of 22,544 and October 18’s peak of 22,955. This region has either capped the market or been quickly surrendered since October 19.
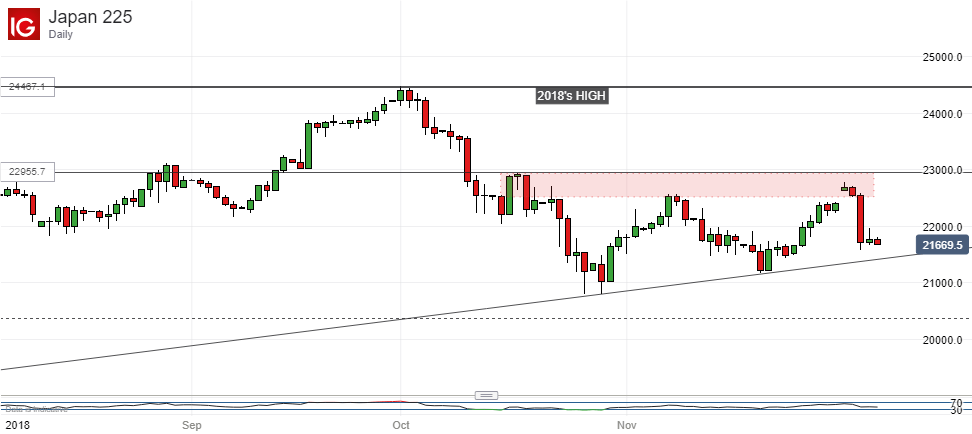
The fall has taken the Nikkei down to a support region between 23,233, which was November 20’s low and the last significant low too. The top comes in around 21,817 which was where the index settled in the middle of last month.
Now, as long as falls are confined to this region, then they probably need not be too serious for the bulls. After all, 2018’s multi-decade peak remains reasonably close as 2018 draws to its end.
However, it is probably worth noting that a close at or below the bottom of that support zone would take the index below a daily-chart uptrend which had previously marked continued progress higher from those October lows.
A sustained period below that would probably put focus back on those lows, with 2018’s overall low of 20,286, struck in March, lurking if they break. Interestingly, that coincides almost exactly with the second, 38.2% Fibonacci retracement of the rise up to this year’s highs from the lows of June, 2016
However, while the overall uptrend holds on a daily or weekly closing basis, it is possible that current weakness will be contained. That being so the uncommitted could be wise to await its fate before coming into the market now.
Resources for Traders
Whether you’re new to trading or an old hand DailyFX has plenty of resources to help you. There’s our trading sentiment indicator which shows you live how IG clients are positioned right now. We also hold educational and analytical webinars and offer trading guides, with one specifically aimed at those new to foreign exchange markets. There’s also a Bitcoin guide. Be sure to make the most of them all. They were written by our seasoned trading experts and they’re all free.
--- Written by David Cottle, DailyFX Research
Follow David on Twitter @DavidCottleFX or use the Comments section below to get in touch!


