Nikkei 225 Technical Analysis Talking Points:
- The Nikkei 225 continues to retreat
- The process was halted by a modest bounce this week
- However a key support zone is very near and will probably be revisited
Get trading hints and join our analysts for interactive live coverage of all major economic data at the DailyFX Webinars.
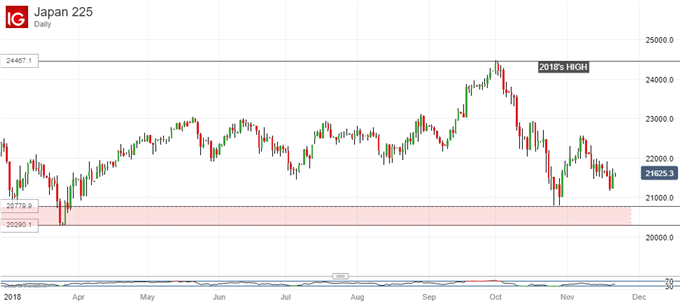
The Nikkei 225’s sharp retreat from October’s 27-year highs goes on. It has now brought the index close to what could prove a key support zone.
Current levels are about 850 points above 20,779. That is the top of a band formed between there and 2018’s low, the 20,299, hit on March 25.

At present, the bulls seem to be staging something of a fightback at support which held in late October. It centers around 21,162. That was also last Monday’s daily close. Should it hold, then perhaps those bulls can use it as a platform for a new foray back towards the previous significant high, November 7’s 22,597. Right now, however, it does not look as though the index has the sort of upward momentum which would be required for a serious or lasting upward test.
The question now then is whether support at this week’s closing low (21,162), will hold at all on a daily or weekly closing basis. If it does not then that key support band will probably come into bearish focus, with deeper falls likely if it gives way too.
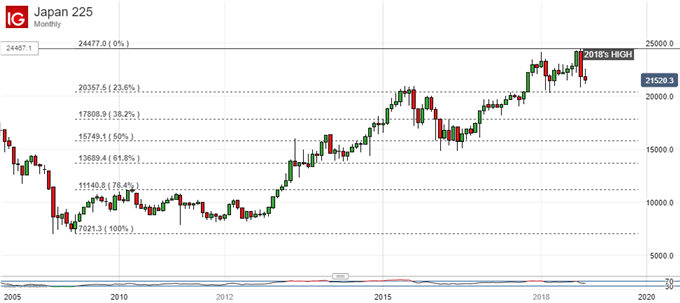
The battered bulls might find a little more solace in the Nikkei’s monthly chart. It shows the index still north of the first, 23.6% retracement of the long rise up from the lows of 2009 to this year’s peak. It comes in at 20,357. That was also a notable top made in mid-2015.

That is likely to offer stern support against any bearish assault, but it is getting uncomfortably close. The monthly chart also looks as though it might be in the process of drawing a head and shoulders pattern, which would suggest that the index may have formed a meaningful top.
Resources for Traders
Whether you’re new to trading or an old hand DailyFX has plenty of resources to help you. There’s our trading sentiment indicator which shows you live how IG clients are positioned right now. We also hold educational and analytical webinars and offer trading guides, with one specifically aimed at those new to foreign exchange markets. There’s also a Bitcoin guide. Be sure to make the most of them all. They were written by our seasoned trading experts and they’re all free.
--- Written by David Cottle, DailyFX Research
Follow David on Twitter @DavidCottleFX or use the Comments section below to get in touch!


