


Nikkei 225 Technical Analysis Talking Points:
- This month’s modest uptrend is hanging on quite nicely
- It has taken the index into an interesting resistance band
- If both hold, then a retest of 2018’s 27-year peak is surely a matter of time.
Get trading hints and join our analysts for interactive live coverage of all major economic data at the DailyFX Webinars.
The Nikkei 225 is in a less certain position than it might seem.
On the one hand, things look quite good for the bulls. Despite the noise of US Midterm elections, the Tokyo blue-chip benchmark remains above the uptrend line with us since late October. Indeed the bulls seem keen to demonstrate that the long run of falls preceding this run higher has not deterred them.
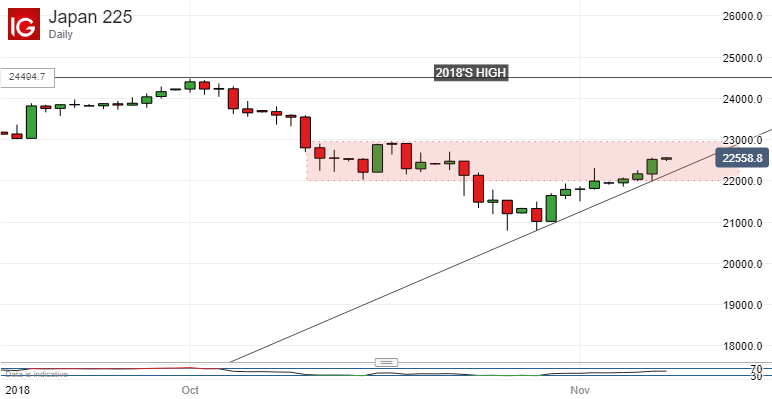
As you can see from the chart above the index has now edged back into an interesting resistance zone. Indeed it might be regarded as base camp for another attempt on the year’s summit. That was the 24,495 hit on October 1, a 27-year high for the Nikkei.
That high peak is still nearly 2,000 points above the market of course but, if the index can hold both its newish uptrend and a position within that resistance band, then another attempt at the top is very likely, possibly within the next couple of weeks.
Meanwhile setbacks are likely to find immediate support at October’s lows in the 20,800 region but, should they give way, there won’t be much between the index and the March low of 20,229.
However, while the Nikkei looks cautiously optimistic on a short-term basis, its weekly chart does seem to be sounding a more cautious note.

In the last three weeks the index has fallen below a monthly uptrend channel which had previously charted its rise up from the lows of mid-2015. That could be significant.
Again, as with the daily chart, it seems that the lows of March this year provide quite solid support, and bulls can probably hope for resurgence. Should they give way at any point then some more emphatic downside protection may be in order.
Resources for Traders
Whether you’re new to trading or an old hand DailyFX has plenty of resources to help you. There’s our trading sentiment indicator which shows you live how IG clients are positioned right now. We also hold educational and analytical webinars and offer trading guides, with one specifically aimed at those new to foreign exchange markets. There’s also a Bitcoin guide. Be sure to make the most of them all. They were written by our seasoned trading experts and they’re all free.
--- Written by David Cottle, DailyFX Research
Follow David on Twitter @DavidCottleFX or use the Comments section below to get in touch!


