


Nikkei 225 Technical Analysis Talking Points:
- Retracement support from June 2016 has held the bears in check so far
- However the bulls have yet to really press their case
- This week’s close could tell us whether they will
Get trading hints and join our analysts for interactive live coverage of all major economic data at the DailyFX Webinars.
The Nikkei 225 fell very sharply though October, as did many other global indexes, as a wave of trade-inspired risk aversion took its toll.
The Tokyo stock benchmark is now more than 2,500 points below its 2018 peak, which was the 24,441 reached on October 1. However, the point at which its fall has so far halted is an interesting one. The 20,767.6 level reached in intraday trade on October 29 and 26 is just about exactly the second, 28.3% Fibonacci retracement of the rise up to this year’s highs from the lows of June 2016.
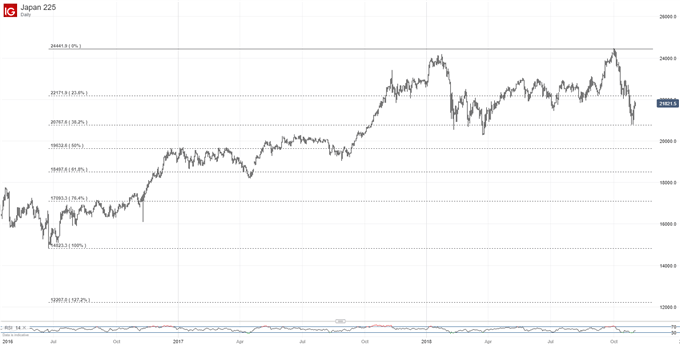
That level has survived two downside tests in the past week and seems to be providing strong support.
Still, the Nikkei remains under near-term pressure for as long as it remains within the daily chart downtrend channel which has contained trade on the way down from October’s peaks.
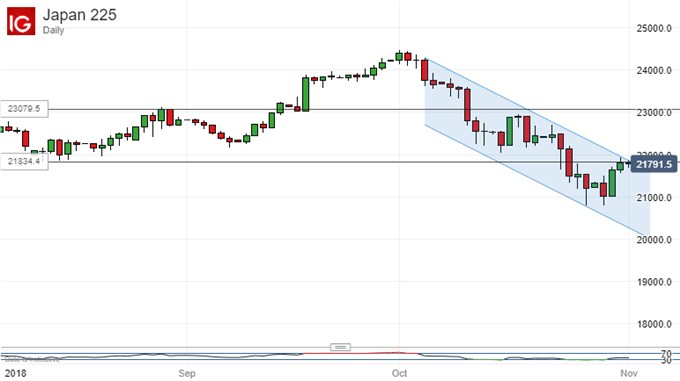
At present, it is threatening to break above it, but has yet to do so conclusively. If it can on a daily or weekly closing basis then the bulls can once again dream of consolidating within the old range shown on the chart above. From there they might be able to build a platform from which to take on those highs again.
However, the uncommitted might be well-advised to wait for more evidence that this sort of resolve will be forthcoming. After all, given the index’s proximity to the channel top this might not involve too long a wait.
Moreover, if the Nikkei cannot manage a daily close above channel resistance then focus will remain on the downside and that retracement point. If it gives way conclusively on a third test (and it might) then support at the March lows of 20,299 will probably beckon.
Resources for Traders
Whether you’re new to trading or an old hand DailyFX has plenty of resources to help you. There’s our trading sentiment indicator which shows you live how IG clients are positioned right now. We also hold educational and analytical webinars and offer trading guides, with one specifically aimed at those new to foreign exchange markets. There’s also a Bitcoin guide. Be sure to make the most of them all. They were written by our seasoned trading experts and they’re all free.
--- Written by David Cottle, DailyFX Research
Follow David on Twitter @DavidCottleFX or use the Comments section below to get in touch!


