Nikkei 225 Technical Analysis Talking Points:
- The Nikkei 225 is back within sight of this year’s peaks
- However, its ascent has been quite rapid and caution may be warranted
- Some consolidation is probably required in the near term
Get trading hints and join our analysts for interactive live coverage of all major economic data at the DailyFX Webinars.
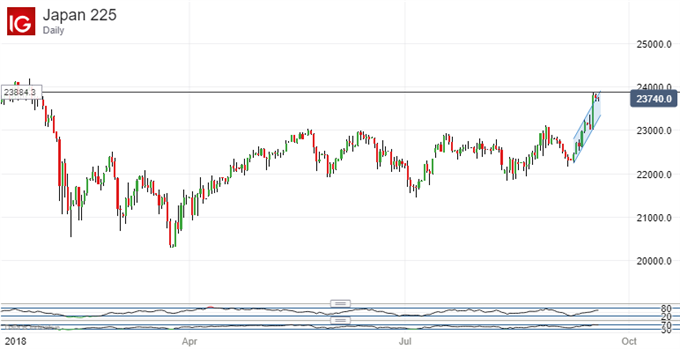
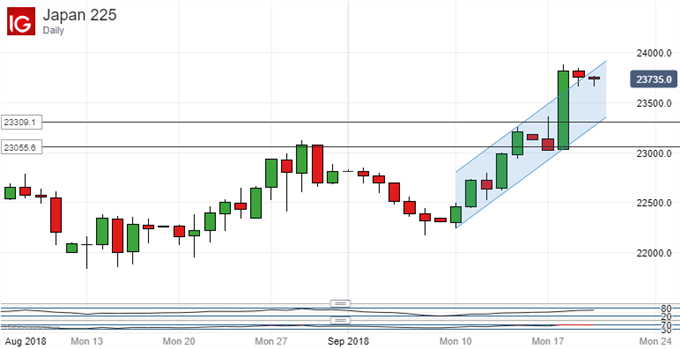
Helped by a stunning rise on September 18, the Nikkei 225 has smashed through the top of its previous uptrend channel and is now back at highs we haven’t seen since January 24, which is where the peaks of 2018 still hover.

Perhaps unsurprisingly however index is starting to look a little overstretched to the upside at current levels. Its Relative Strength Index loiters at a modestly worrying 73, just above the 70 point above which things can start to look a little overbought.
The simple moving averages at 20-, 50- and 100 days remain in chronological order, but they are all now some way below the market.
What all this suggests is that the next few days’ trade could be very interesting. If the bulls decide to push on from here in short order then those signs of exhaustion will only become more acute and the chance of a sharp retracement will hold up.
However, if the index manages to consolidate somewhere between current levels and this year’s peak so far (January 23’s 24,192), then that could be a very encouraging sign.
After all, plenty of investors must be sitting on substantial profit at these levels. If they see no need to cash it out, it implies that they think there could yet be more to come into year-end and perhaps beyond.
Still, the problem with such a rapid upward spurt is that likely support points near at hand can be hard to spot. There will probably be some support around the 23055.6 level. That represents the first, 23.6% Fibonacci retracement of the rise up to current levels from the lows of late March. There is also possibly upward channel support at 23309.1, but that may not endure a stern test.

The index looks to be in a rather transitional phase, and the uncommitted could be well-advised to wait and see whether the recent impressive run of gains can stick. It’s a time for daily close watching, perhaps.
Resources for Traders
Whether you’re new to trading or an old hand DailyFX has plenty of resources to help you. There’s our trading sentiment indicator which shows you live how IG clients are positioned right now. We also hold educational and analytical webinars and offer trading guides, with one specifically aimed at those new to foreign exchange markets. There’s also a Bitcoin guide. Be sure to make the most of them all. They were written by our seasoned trading experts and they’re all free.
--- Written by David Cottle, DailyFX Research
Follow David on Twitter @DavidCottleFX or use the Comments section below to get in touch!


