


Nikkei 225 Technical Analysis Talking Points:
- The Nikkei 225 has been in thrall to trade-spat fundamentals this week
- However the technical chart could be suggesting a rather bearish pattern
- The next few days’ trade could be telling
Find out what retail investors make of the Nikkei 225’s prospects right now at the DailyFX Sentiment Page
The Nikkei 225 has endured a torrid week, with fundamentals perhaps leaning harder on this market than any technical factor.
Worries about a steady ratcheting up in the trade spat between the US and, most prominently, China have seen many indexes in retreat and the Tokyo stock benchmark offers a particularly hard-hit example.
However, the Nikkei’s falls this week have raised one possible technical specter, and it’s an especially frightening one for bulls. The index could be in the process of making a double top, as you can see on the chart below.

The 21907 area now becomes especially interesting. If we are seeing that worrying double top formation then it becomes the crucial ‘pullback’ low. A fall though it could put the entire climb up from the lows of late March into question.
The situation bears close watching however, as this week’s lurch lower on those trade worries may mean that the Nikkei can erase this formation and get back on the upward track after all. For one thing, it is not obviously overbought. Indeed its Relative Strength Index is rather heading lower towards oversold territory and now stands at a hardly-concerning 52.
Should trade simmer down as the prime market mover then we might see a bounce back up to the 22820 level which preceded this week’s falls. If we do, then the double-top thesis would be in severe doubt and some continuation of the uptrend seen since May 29 can probably be expected.
The bulls’ task then would be to consolidate around that level, and prove they can remain durably at the highs hit so briefly in mid May.
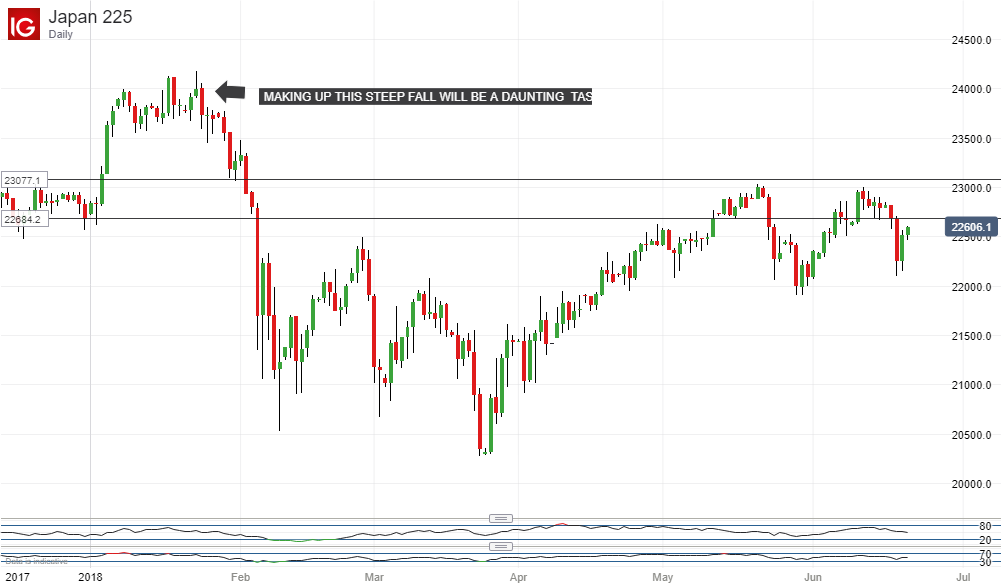
However, it’s then, arguably, that their real problems will begin. For, to make progress from there, they will have to rise back above the steep falls we saw from the year’s highs which occurred between late January and early February. This will take concerted effort but, while we hold above that pullback low, an attempt, at least probably shouldn’t be ruled out.
Resources for Traders
Whether you’re new to trading or an old hand DailyFX has plenty of resources to help you. There’s our trading sentiment indicator which shows you live how IG clients are positioned right now. We also hold educational and analytical webinars and offer trading guides, with one specifically aimed at those new to foreign exchange markets. There’s also a Bitcoin guide. Be sure to make the most of them all. They were written by our seasoned trading experts and they’re all free.
--- Written by David Cottle, DailyFX Research
Follow David on Twitter @DavidCottleFX or use the Comments section below to get in touch!


