


NIKKEI 225 TECHNICAL ANALYSIS, TALKING POINTS:
- The Nikkei 225 has bounced at important Fibonacci support
- The bulls have managed to push on nicely
- This process looks as though it may well have further to run.
What makes some people stand out in the market? Check out the DailyFX deep, deep dive into The Traits of Successful Traders.
The Nikkei 225 has bounced at key resistance and the momentum seems to be very much with the bulls once again.
The index spent much of late May in retreat from its recent significant high. That was 23044.5 hit on May 21, an altitude not previously seen since early February. However, the retreat halted quite clearly at the second, 38.2% Fibonacci retracement of rise between March 25’s low and that May 21 peak.
That comes in at 21990.1, a support level which looks pretty firm.
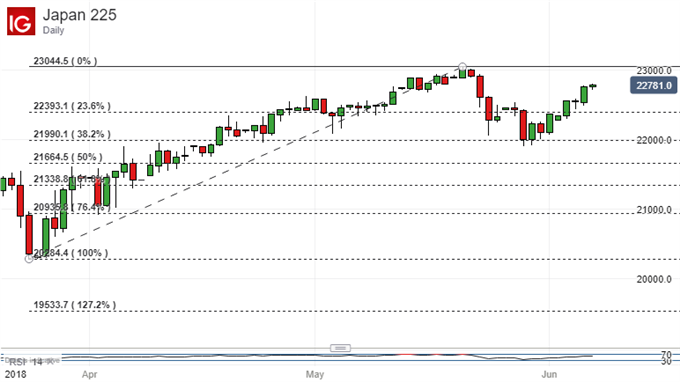
Bulls now have their focus squarely on 23044,5 again and, for as long as the current uptrend channel contains trade, then they’ll get there- possibly in quite short order.
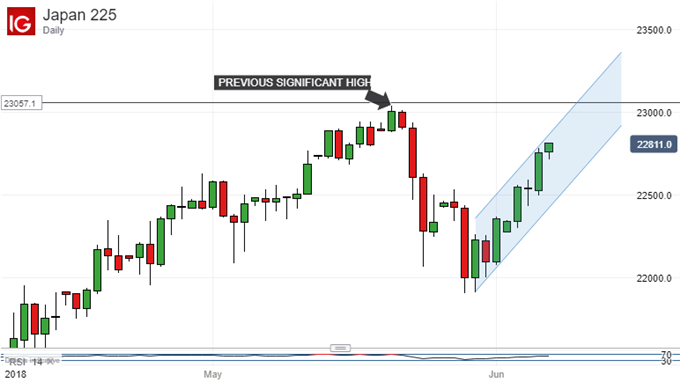
Momentum indicators don’t suggest any overbuying at this point and, while the index remains above its 20-, 50- and 100-day moving averages, it would not appear to be dramatically extended above any of them.
If that previous peak can be recaptured, then the next point of interest on the upside would be 2018’s overall high –the 24177.2 hit on January 23. That might well prove a tall order, and indeed is almost certain to do so if we don’t see a period of consolidation.
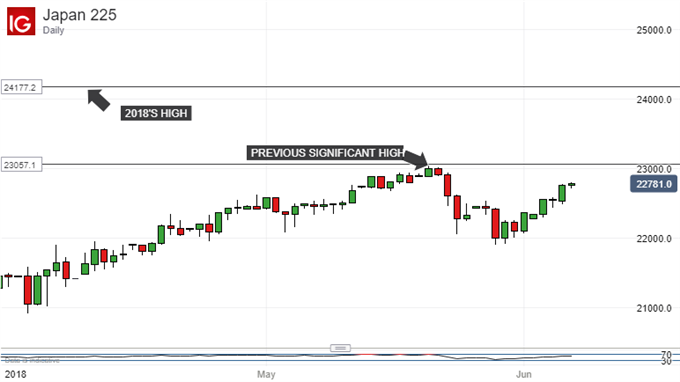
However, with downside support solid and a clear uptrend well entrenched, it’s probably worth playing cautiously for further gains, revisiting the strategy once 23044.5 has been topped.
One fundamental risk point which might be worth keeping an eye on is this weekend’s Meeting in Quebec of the Group of Seven industrialized democracies. At present this seems likely to be a rather fraught conclave as regards global trade. Leaders meet with US threats of new tariffs hanging in the air, against which other G7 members have already protested in the strongest terms. Signs of new tensions could hit equity markets generally.
RESOURCES FOR TRADERS
Whether you’re new to trading or an old hand DailyFX has plenty of resources to help you. There’s our trading sentiment indicator which shows you live how IG clients are positioned right now. We also hold educational and analytical webinars and offer trading guides, with one specifically aimed at those new to foreign exchange markets. There’s also a Bitcoin guide. Be sure to make the most of them all. They were written by our seasoned trading experts and they’re all free.
--- Written by David Cottle, DailyFX Research
Follow David on Twitter @DavidCottleFX or use the Comments section below to get in touch!


