


NIKKEI 225 TECHNICAL ANALYSIS: TALKING POINTS:
- The Nikkei 225 has slipped back a little this week
- Global risk appetite has probably had much to do with the slide
- However key support is now very close
Find out what the #1 mistake that traders make is, so you never have to join them!
The Nikkei 225 has taken a sharp downturn this week, in common with some other global bourses The slide
‘s fundamental roots are in worries about US/China trade and increased political risk in the European Union, which has come unhelpfully at a time when the economic data are softening too.
Technically speaking, the Japanese equity benchmark has now dropped out of the downtrend channel which has persisted since April 6 on its daily chart and was itself merely a continuation of the rise from late-
March lows. So far, falls have been limited to the previous significant high, February 27’s intraday peak of 22,495, which seems to be acting as support. It is under quite severe pressure though.
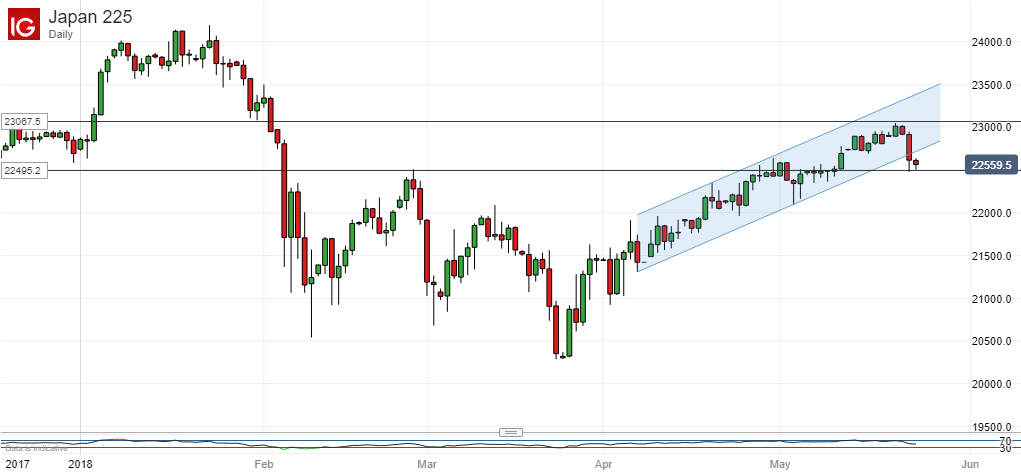
Should it give way, on a daily or weekly closing basis, investors can look for support quite close to current levels, at 22367. That is where the first. 23.6% Fibonacci retracement of the rise since late March comes in. Below that, the focus would be on 38.2% retracement, which would be seen on any fall to 21970.5. A fall of that magnitude, however, might suggest that something more than a consolidation is in hand and that the index may still have further to fall.

For the moment, the bullish-consolidation argument still looks quite plausible, with the index’s momentum slipping very sharply from the close-to overbought levels of a few days ago.
The bulls shouldn’t leave matters as they for long though. The year’s (January) peaks remain some way off and, before they can be attempted once more, then the steep fall seen in late January and early February will have to be made back.
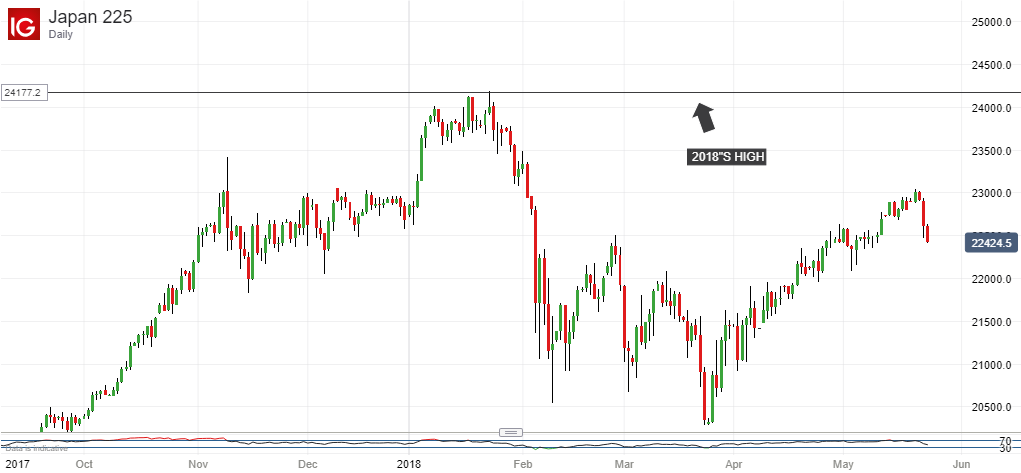
Bulls will need to get a new uptrend back on track if they are to have a stab at that task.
RESOURCES FOR TRADERS
Whether you’re new to trading or an old hand DailyFX has plenty of resources to help you. There’s our trading sentiment indicator which shows you live how IG clients are positioned right now. We also hold educational and analytical webinars and offer trading guides, with one specifically aimed at those new to foreign exchange markets. There’s also a Bitcoin guide. Be sure to make the most of them all. They were written by our seasoned trading experts and they’re all free.
--- Written by David Cottle, DailyFX Research
Follow David on Twitter @DavidCottleFX or use the Comments section below to get in touch!


