


Talking Points:
- The Japanese benchmark has stalled, but it has done so at a pretty high level
- If many investors want to cash out, it’s not obvious
- The moving averages tell a bullish tale too
What do some traders have that all traders want? We’ve tried to define the Traits of Successful Traders
The Nikkei 225’s daily technical charts aren’t giving much away, it must be admitted.
For sure the Japanese equity benchmark snapped quite a steep an uptrend channel from September 8’s lows with two modestly lower closes on the 21st and 22nd of the same month. But even so it remains very close to its high for 2017- September 21st’s intraday top of 20,498. That’s also the highest level reached since August, 2015.
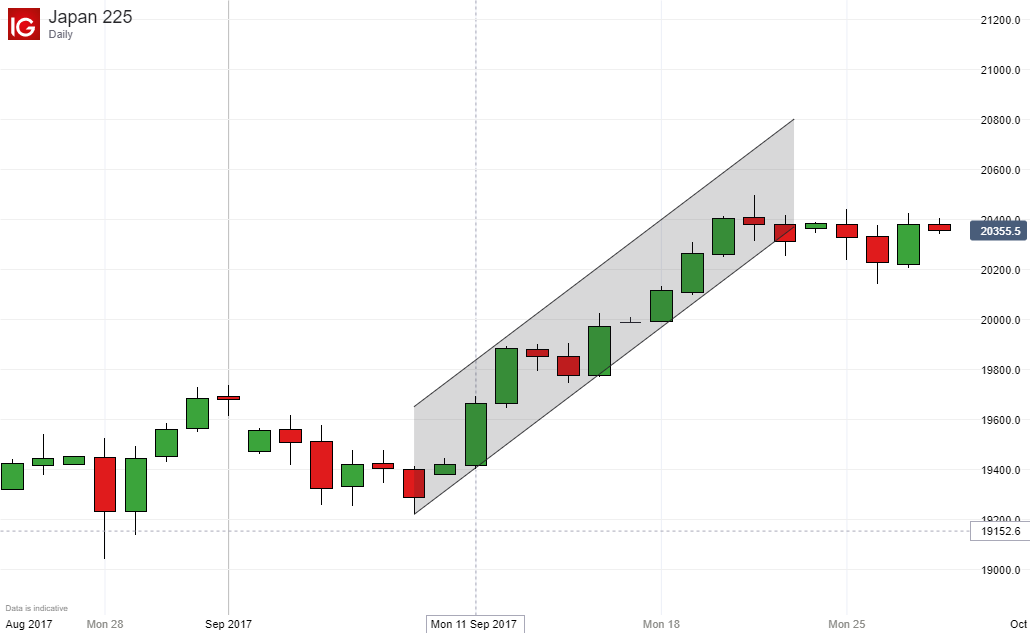
Moreover, it’s clear that there is plentiful appetite to hold the index even at current very elevated levels, with no obvious sign of widespread profit-taking. This could be taken as quite encouraging from the bulls’ perspective, especially given the rarity of forays to this altitude in the past two years.
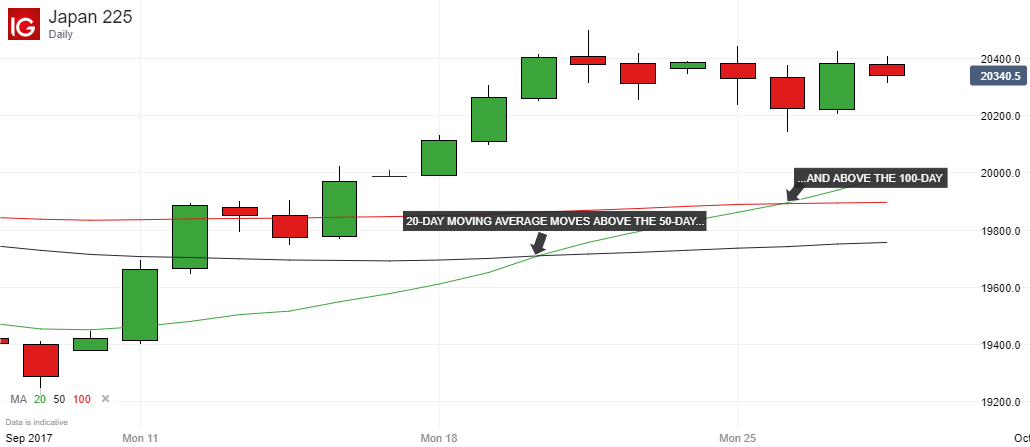
Momentum indicators aren’t offering any obvious clues with neither the Relative Stength or Money Flow Indexes suggesting significant overbuying at this point. However, a look at the simple movng averages offers more encouragement. The shorter-term, 20-day average crossed above the 50-day on September 20 and went on to cross above the 100-day on the Tuesday this week. This sort of action is known as a bullish crossover and now we’ve seen two in short order.
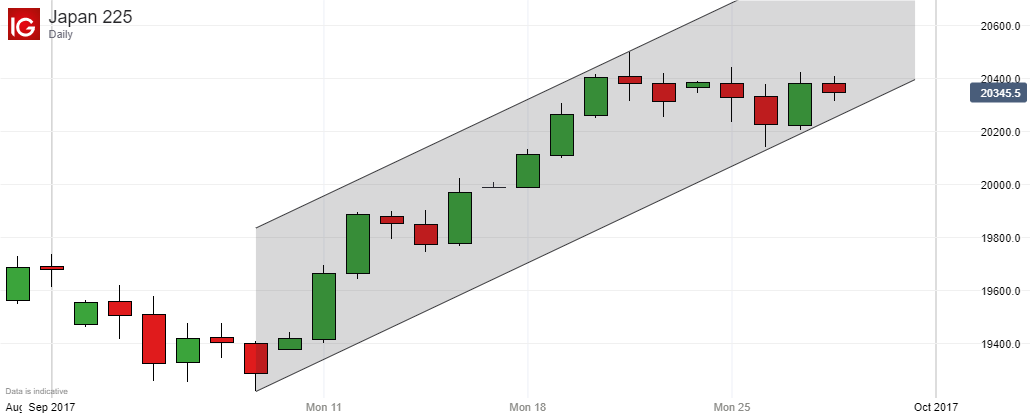
Added to the lack of selling impetus at the highs, the moving averages strongly suggest that what we’re seeing here is a consolidative pause before another push higher. For evidence, keep an eye on this new uptrend channel which contains all the action since that September 8 low. It’s not yet incredibly persuasive but if it holds into this week’s close then that prognosis will be a little surer.
If the index manages to push on further into new-high territory for the year it will be worth watching the money flow numbers more closely too for evidence of investor conviction.
--- Written by David Cottle, DailyFX Research
Contact and follow David on Twitter: @DavidCottleFX


