


Talking Points:
- The Nikkei 225 has been around, or above 20,000 since early June
- There’s been little impetus to push on, but not much selling pressure either
- Does something have to give?
Where’s your favourite asset headed in the third quarter? Check out the DailyFX technical and fundamental analysis
If you’re going to get stuck, then there are worse places to do it.
The Nikkei 225 is certainly struggling to make progress to the upside and has done so since the start of June. However, the index remains close to its highs for 2017 and indeed, peaks not seen since the fall of 2015. Moreover, it is looking rather comfortable around the psychologically important 20,000 level, where it has loitered for about six weeks.
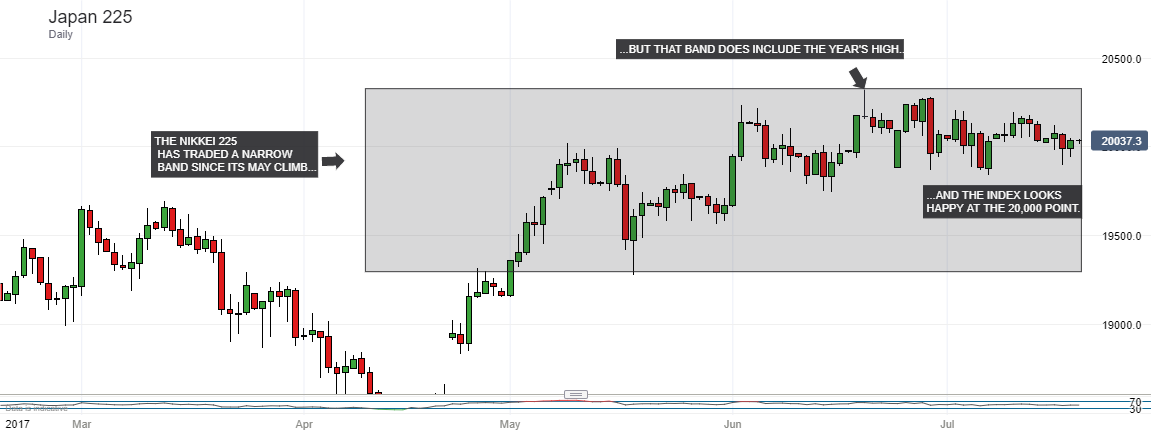
Of course, this comfort has limits. For the optimist, it’s clear that there was no great knee-jerk urge to sell the index on arrival at 20,000. Investors are clearly happy to be long, even up here. The pessimist might note that it’s been a very long time indeed since the Nikkei offered investors enduring, consistent upside at these levels. The last notable foray – in early 2015 – was measured in mere months and offered little more than 1,000 points of upside beyond 20,000.
Now, with momentum indicators such as the Relative Strength Index still noncommittal and certainly not suggesting overbuying, we’ll have to rely on crumbs of recent trading information to try and gauge likely future moves. One bit of possibly-good news is that the index’s range base seems to have moved measurably higher, as I suspected it was doing last week.
The old base around 19500 and predicated on May’s trade seems to have been replaced quite convincingly by support in the 19800 area from Mid-June.
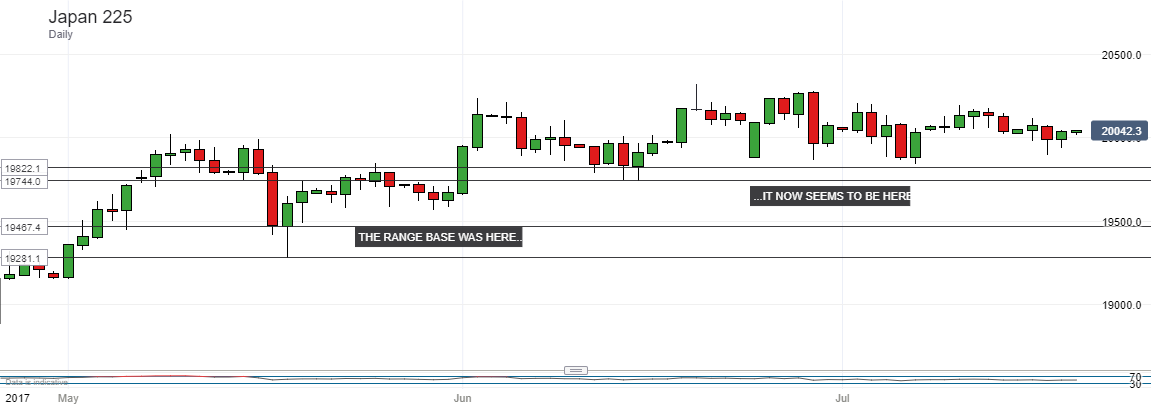
While these levels hold it seems doubtful that investors need fear more significant near-term slippage.
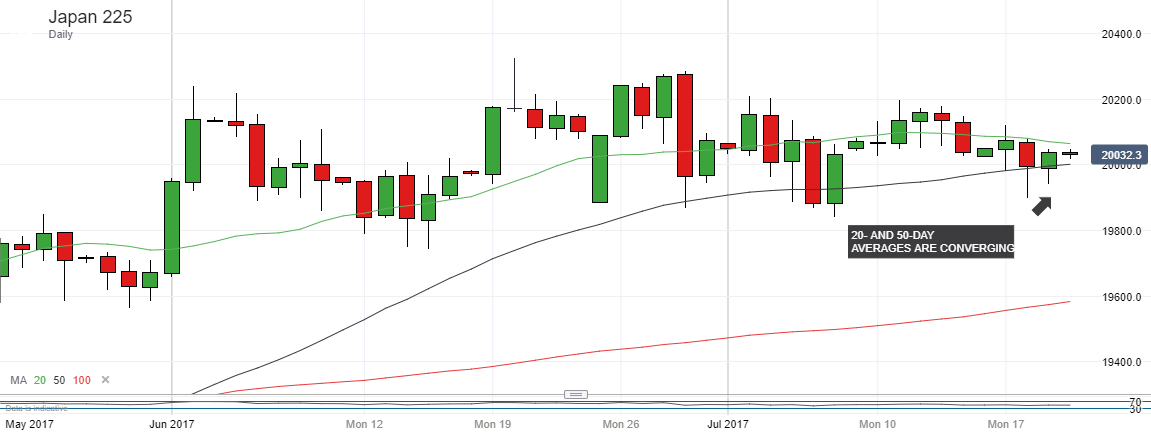
However, it will pay to keep an eye on the simple moving averages too. They’re all sloping reassuringly upward still, but the 20-day variant is flattening out and may be on course to converge or even cross below the 50-day. Traditionalists would see this as a bearish sign and, whatever your view, this might well be something to watch in the absence of other, clearer leads.
--- Written by David Cottle, DailyFX Research
Contact and follow David on Twitter: @DavidCottleFX


