Talking Points:
- The Nikkei 225 is close to its highs for the year, and indeed 17-month peaks
- So, can it stay here?
- Well yes, if it can consolidate, but watch that RSI
Hone your strategy in the Nikkei and across the Asian-market board with the DailyFX trading guide
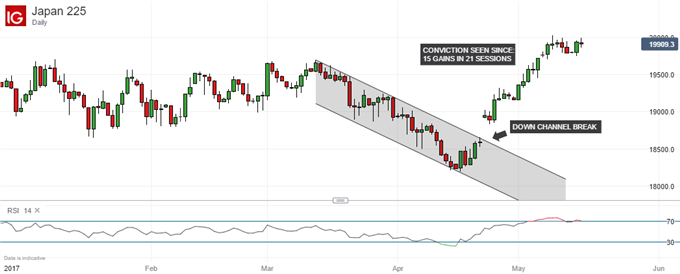
The Nikkei 225 has made its highs for the year in the past week. Indeed, it is now loitering around peaks not seen since the end of 2015.
From such a lofty peak there’s only one question investors care about, no matter what the asset: can it stay here?
Well, the technical signs are rather mixed as you’d expect. But they’re by no means universally gloomy.
For one thing, the current thrust higher from April 17 has quite convincingly broken a notable down-channel in place since March 13. In the 21 trading sessions since that break the index has managed 13 daily gains and only seven (modest) losses on the way to current highs.

That’s hardly a timorous rise and suggests a fair degree of conviction.
Moreover, the last time the index got up to these levels, it only stayed there for about twelve trading sessions before collapsing in exhaustion. This was back in 2015. This time it has already occupied the heights around 199800 for eight trading days. So, a weekly close around current levels and range trading into next week would be a pretty good sign for those worried that history will repeat itself.
The devil in this detail looks to be the Relative Strength Index, or RSI. This momentum indicator has been in what most analysts would consider the safe zone for much of this year. That’s the area between 30 and 70 which suggests that the asset in question is neither heavily overbought nor oversold.
However, the most recent Nikkei gain has seen the RSI edge into what most analysts would consider overbought territory. At around 73 the index is not suggesting catastrophic over-buying, and indeed it has fallen somewhat from the peaks around 76 made on May 10. But it’s still above 70 and, for as long as it is, some buyers may be deterred.
So, back to the big question. Can the Nikkei stay up here and maybe even push on?
Well, yes. But a couple of things probably have to happen to make this more certain. First, a degree of consolidation at or around current levels. Secondly, that RSI has to slip back into the safety zone. This would probably occur as a function of that consolidation, although that is not absolutely certain.
One danger to watch for if the index cannot hang on is one I have flagged before. That downside channel we were talking about earlier took the Nikkei below its 2017 trading range, albeit only briefly as it turned out, when support at 18754 broke on April 6.
If this current foray higher falters, then there is probably more room to the downside than there might have been had the range endured.
--- Written by David Cottle, DailyFX Research
Contact and follow David on Twitter: @DavidCottleFX


