


Talking Points:
- Nikkei 225 broke above the 16,500 level which might act as support
- If correlated risk assets gather positive momentum, the index may head for a range top
- Gains appear to be corrective within context of the near term down trend
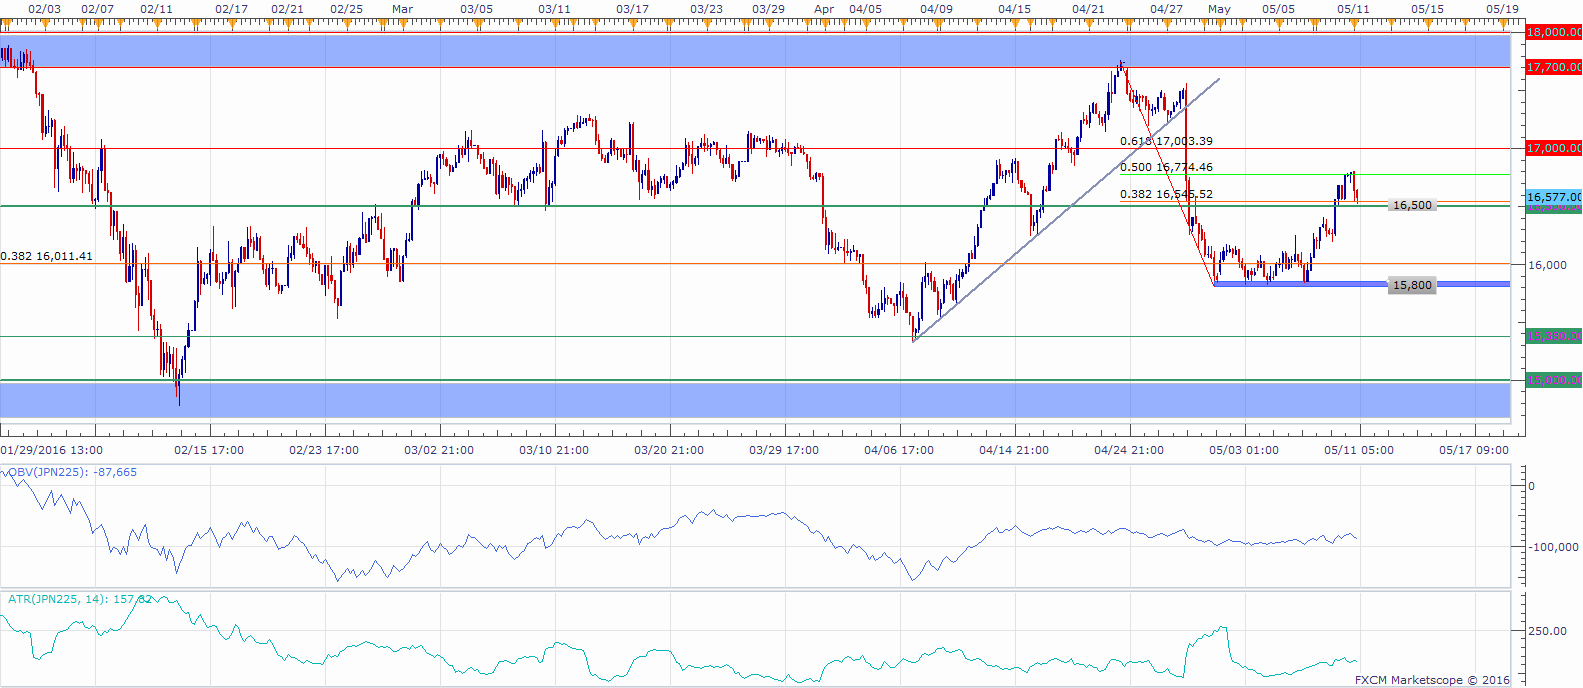
The Nikkei 225 has traded higher after finding support around the 15,800 level, and broke through the 16,500 resistance level which coincides with the 0.382 Fib as measured from the April 22 high at 17,769. The Index stalled at around 16,775, which is the 0.50 Fib, and now appears to test the 16,500 level that may act as support for a follow-through move higher.
The price has been ranging between the well-defined 18,000 resistance zone and the 15,000 support since the start of the year, with gains appearing to be corrective in the context of the near term down trend. However, if other correlated “risk assets” find strength, the index may head higher, with the next possible significant resistance appearing to be the 17,000 handle followed by the range top 18,000 resistance zone.
Levels of interest on a move lower may be the 16,000 handle followed by the prior support at around 15,800, with the range bottom at 15,000. Interim support might be found at the April 7 low at around 15,380.
Learn about the proper tenets of risk management with FXCM’s “Traits of Successful Traders” series
Nikkei 225 H4 Chart: May 11, 2016
--- Written by Oded Shimoni, DailyFX Research
To contact Oded Shimoni, e-mail instructor@dailyfx.com


