


Sterling Technical Price Outlook: GBP/USD Trade Levels
- Sterling technical trade level update – Daily & Intraday Charts
- GBP/USD recovery fails at technical resistance – rally vulnerable sub-1.35
- Critical support 1.31 – weakness beyond would risk larger correction in British Pound
Sterling is down more than 0.7% against the US Dollar early in the week after gapping higher into the Sunday open with GBP/USD reversing off technical resistance on Monday. The broader correction off the yearly highs is now in question and we’re looking for a break of the weekly opening-range for guidance in the days ahead. These are the updated targets and invalidation levels that matter on the GBP/USD price charts. Review my latest Weekly Strategy Webinar for an in-depth breakdown of this Cable trade setup and more.
Sterling Price Chart – GBP/USD Daily
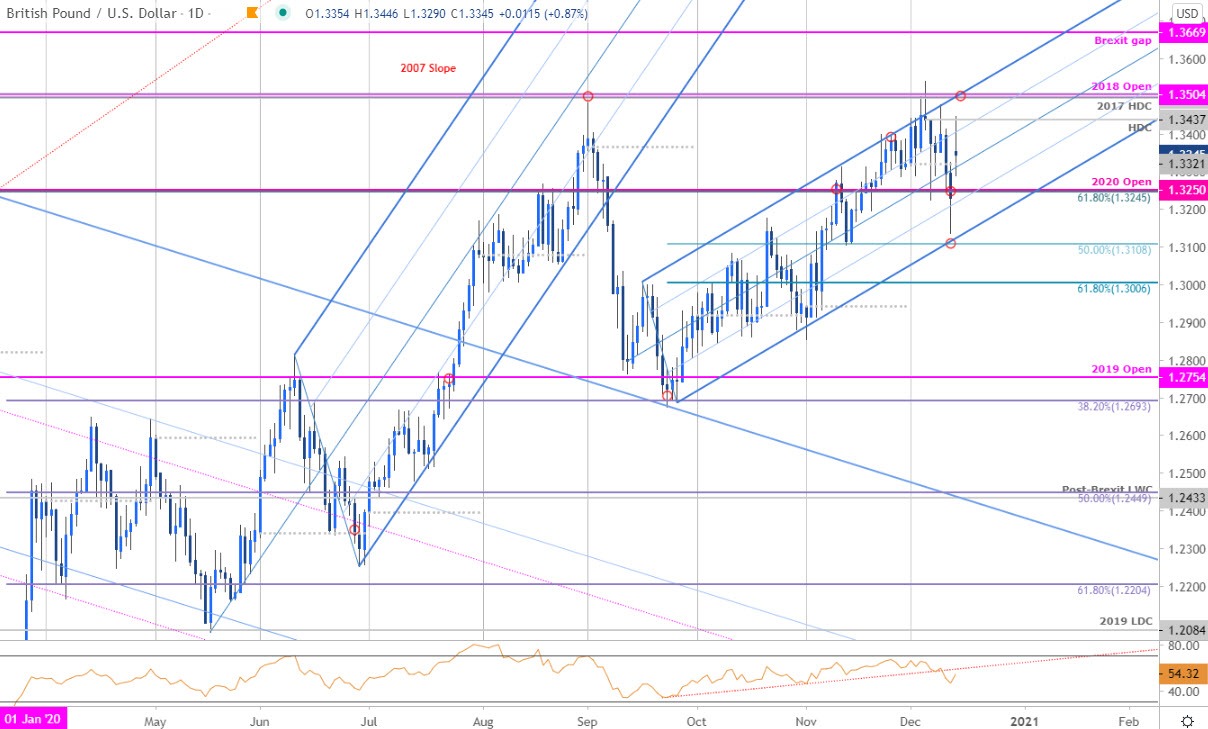
Chart Prepared by Michael Boutros, Technical Strategist; GBP/USD on Tradingview
Technical Outlook: The British Pound reversed off a key resistance pivot early in the month at 1.3495-1.3504 - a region defined by the 2017 high-day close and the 2018 yearly open. A pullback off this threshold marked two equal legs off the highs before exhausting on Friday with a gap into the weekly open failing today a the 2020 high-day close at 1.3437. Is the recovery over?
Critical resistance remains at the upper parallel of the ascending pitchfork formation we’ve been tracking off the September lows around the 1.35-handle – a breach / close above is needed to mark resumption of the broader uptrend with such a scenario exposing the Brexit gap at 1.3670. Daily support steady at the 61.8% Fibonacci retracement of the 2018 decline, the objective 2020 yearly open 1.3245/50 with a break / close below 1.3108 suggest a more significant high was registered last week.
Sterling Price Chart – GBP/USD 120min
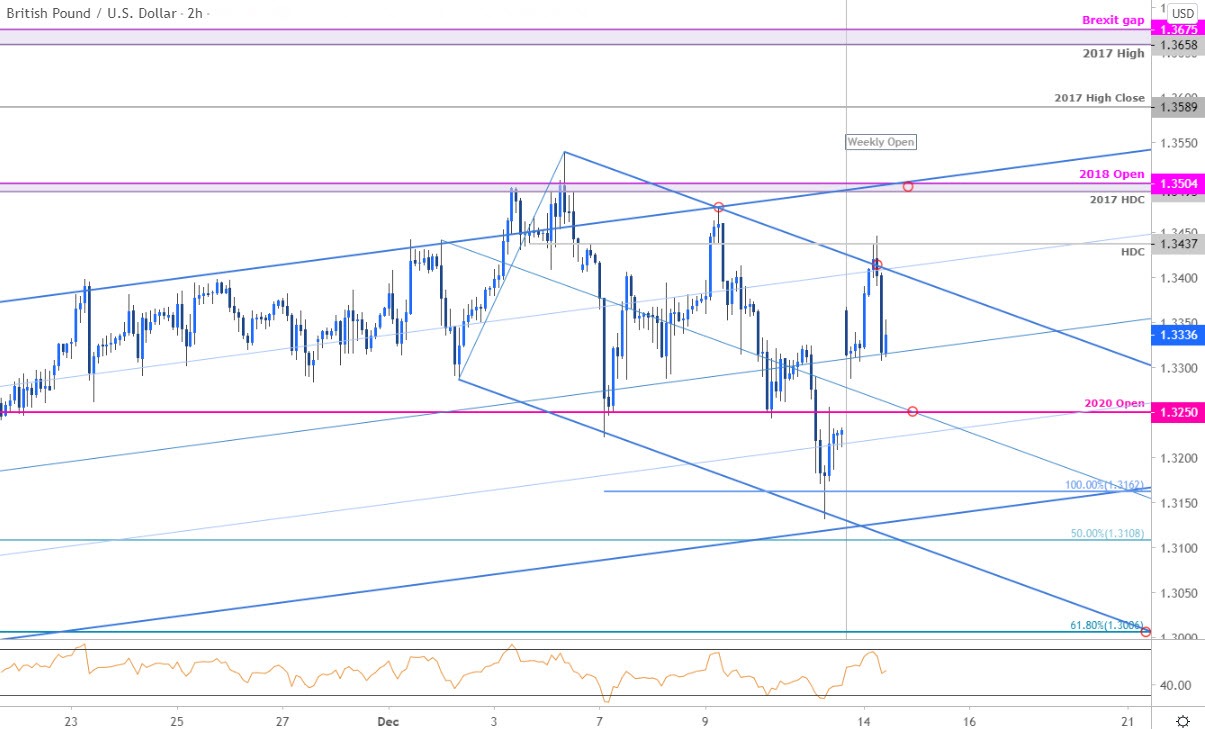
Notes: A closer look at Sterling price action shows GBP/USD trading within an embedded descending pitchfork extending off the yearly highs with the weekly open advance failing at the upper parallel / high-day close earlier today. Initial support rests with the median-line backed by 1.3250 with 1.3162 and 1.3108 still zones of interest for possible downside exhaustion IF reached. Ultimately a topside breach above uptrend resistance is needed to mark resumption towards the 2017 high close at 1.3589 and 1.3658/75.

Bottom line: Sterling is carving the weekly opening-range just below the high-day close and we’re looking to the break for guidance. From a trading standpoint, the threat remains for deeper correction in British Pound while below 1.35 – ultimately a larger setback may offer more favorable entries closer to uptrend support with a breach above likely to fuel accelerated gains in Cable. Review my latest British Pound Weekly Price Outlook for a closer look at the longer-term GBP/USD technical trade levels.
For a complete breakdown of Michael’s trading strategy, review his Foundations of Technical Analysis series on Building a Trading Strategy
Sterling Trader Sentiment – GBP/USD Price Chart
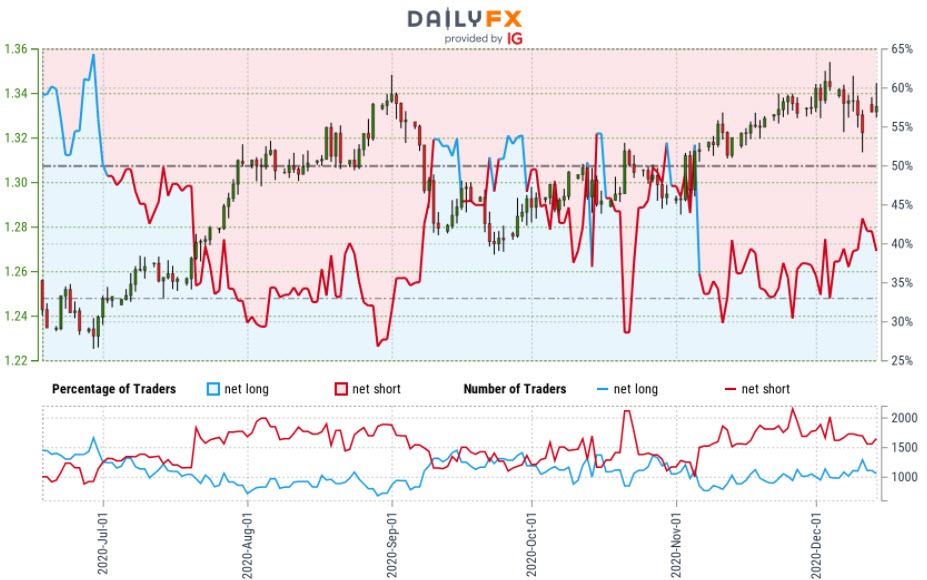
- A summary of IG Client Sentiment shows traders are net-short GBP/USD - the ratio stands at -2.00 (33.36% of traders are long) – typically bullish reading
- Long positions are7.16% lower than yesterday and 21.46% lower from last week
- Short positions are31.96% higher than yesterday and 29.87% higher from last week
- We typically take a contrarian view to crowd sentiment, and the fact traders are net-short suggests GBP/USD prices may continue to rise. Traders are further net-short than yesterday and last week, and the combination of current positioning and recent changes gives us a stronger GBP/USD-bullish contrarian trading bias from a sentiment standpoint.
| Change in | Longs | Shorts | OI |
| Daily | 3% | -7% | -3% |
| Weekly | 4% | -10% | -5% |
---
Key UK / US Data Releases

Economic Calendar - latest economic developments and upcoming event risk.
Active Trade Setups
- Australian Dollar Outlook: Aussie Breakout Crosses Big Fig at 7500
- Canadian Dollar Outlook: Loonie at the Lows- USD/CAD Breakout Pending
- Gold Price Outlook: Gold Stages December Rally- Is a Low In Place?
- Mexican Peso Outlook: USD/MXN Bears Tire Near Downtrend Support
- Written by Michael Boutros, Currency Strategist with DailyFX
Follow Michael on Twitter @MBForex


