


GBP/USD Price Technical Forecast
GBP/USD - Corrects Higher
Last week, British Pound recovered some of its recent losses against US Dollar. On Friday, GBP/USD rallied to 1.2485 then closed in the green with 6.8% gain. This week, the recovery has slowed down yet the pair remained above 1.2200 handle.
The Relative Strength Index (RSI) abandoned the oversold territory and crossed above 50 reflecting the end of downtrend move and a possible start of uptrend move.
GBP/USD DAILY PRICE CHART (Nov 14, 2018 – April 1, 2020) Zoomed out


GBP/USD DAILY PRICE CHART (JAN 30– April 1, 2020) Zoomed IN
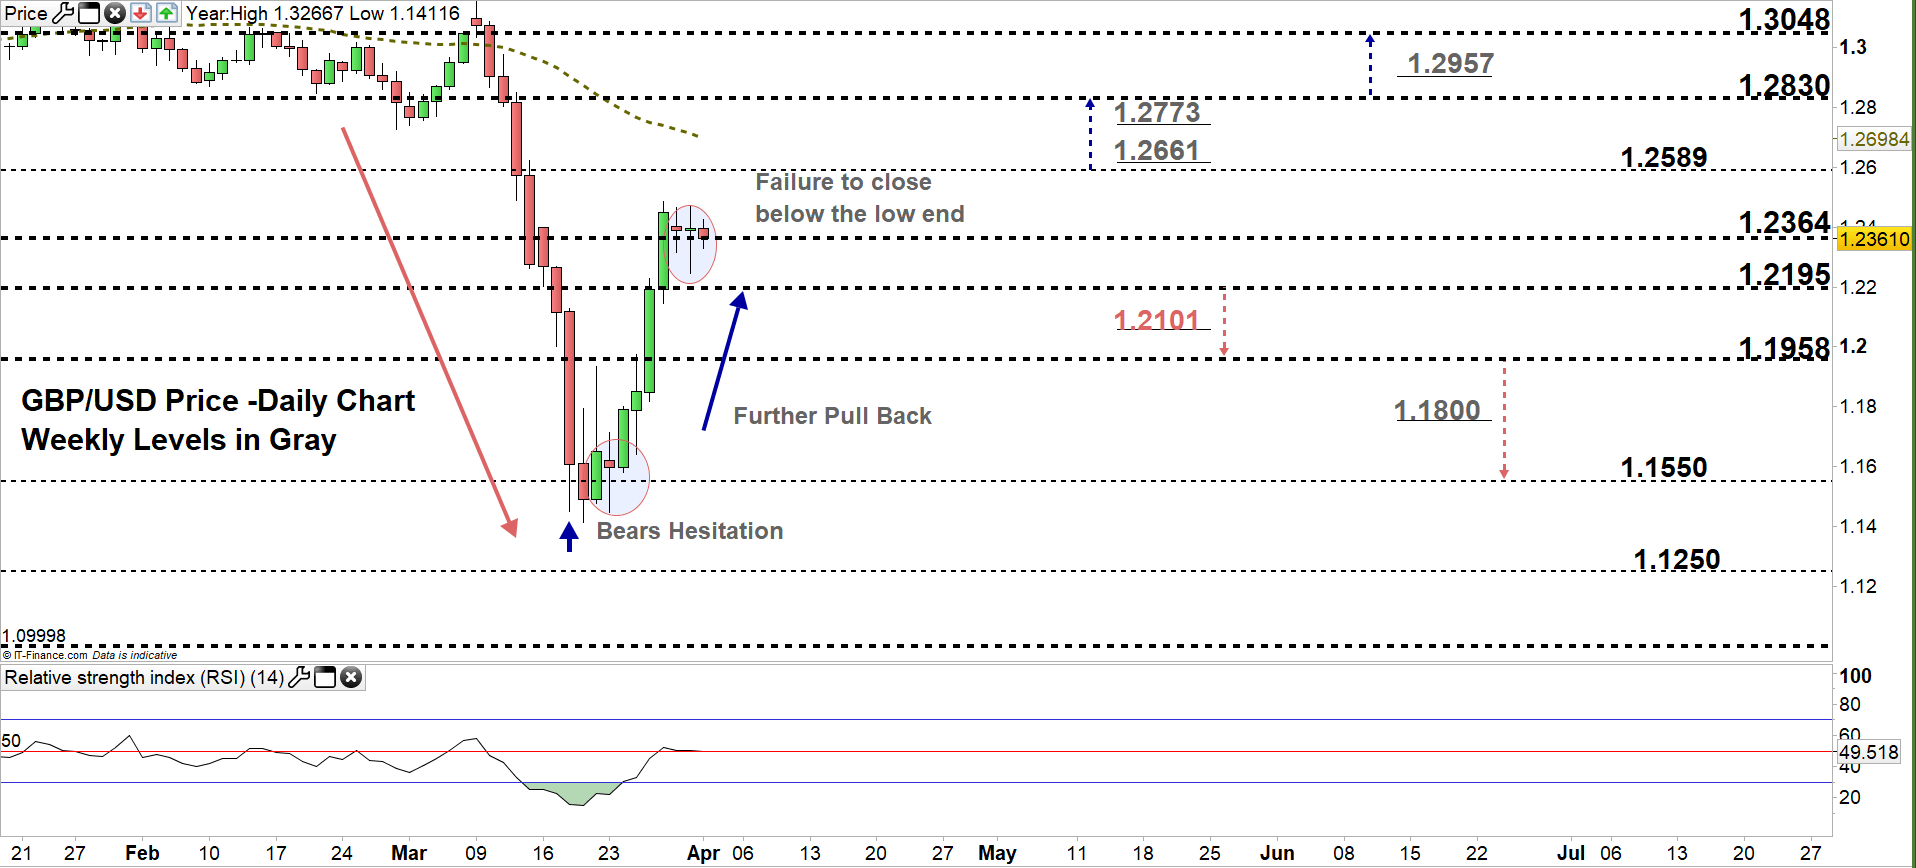
From the daily chart, we noticed that on March 19 GBP/USD tumbled to 1.1411- its lowest level in thirty-five years. Later on, bears showed reluctance, and this led the market to surge and remain in current trading zone 1.2364 – 1.2589 .This week, bears failed twice to press towards the lower trading zone.
A close above the high end of the zone may encourage bulls to push towards 1.2830. Further close above this level could mean more bullishness towards 1.3048. In that scenario, the weekly resistance levels underscored on the chart (zoomed in) should be kept in focus.
On the other hand, any close below the low end of the zone could lead GBPUSD towards 1.2195. Further close below that level might send the price even lower towards 1.1958. That said, the daily and weekly levels marked on the chart should be monitored.

GBP/USD Four Hour PRICE CHART (Mar 7 – April 1, 2020)
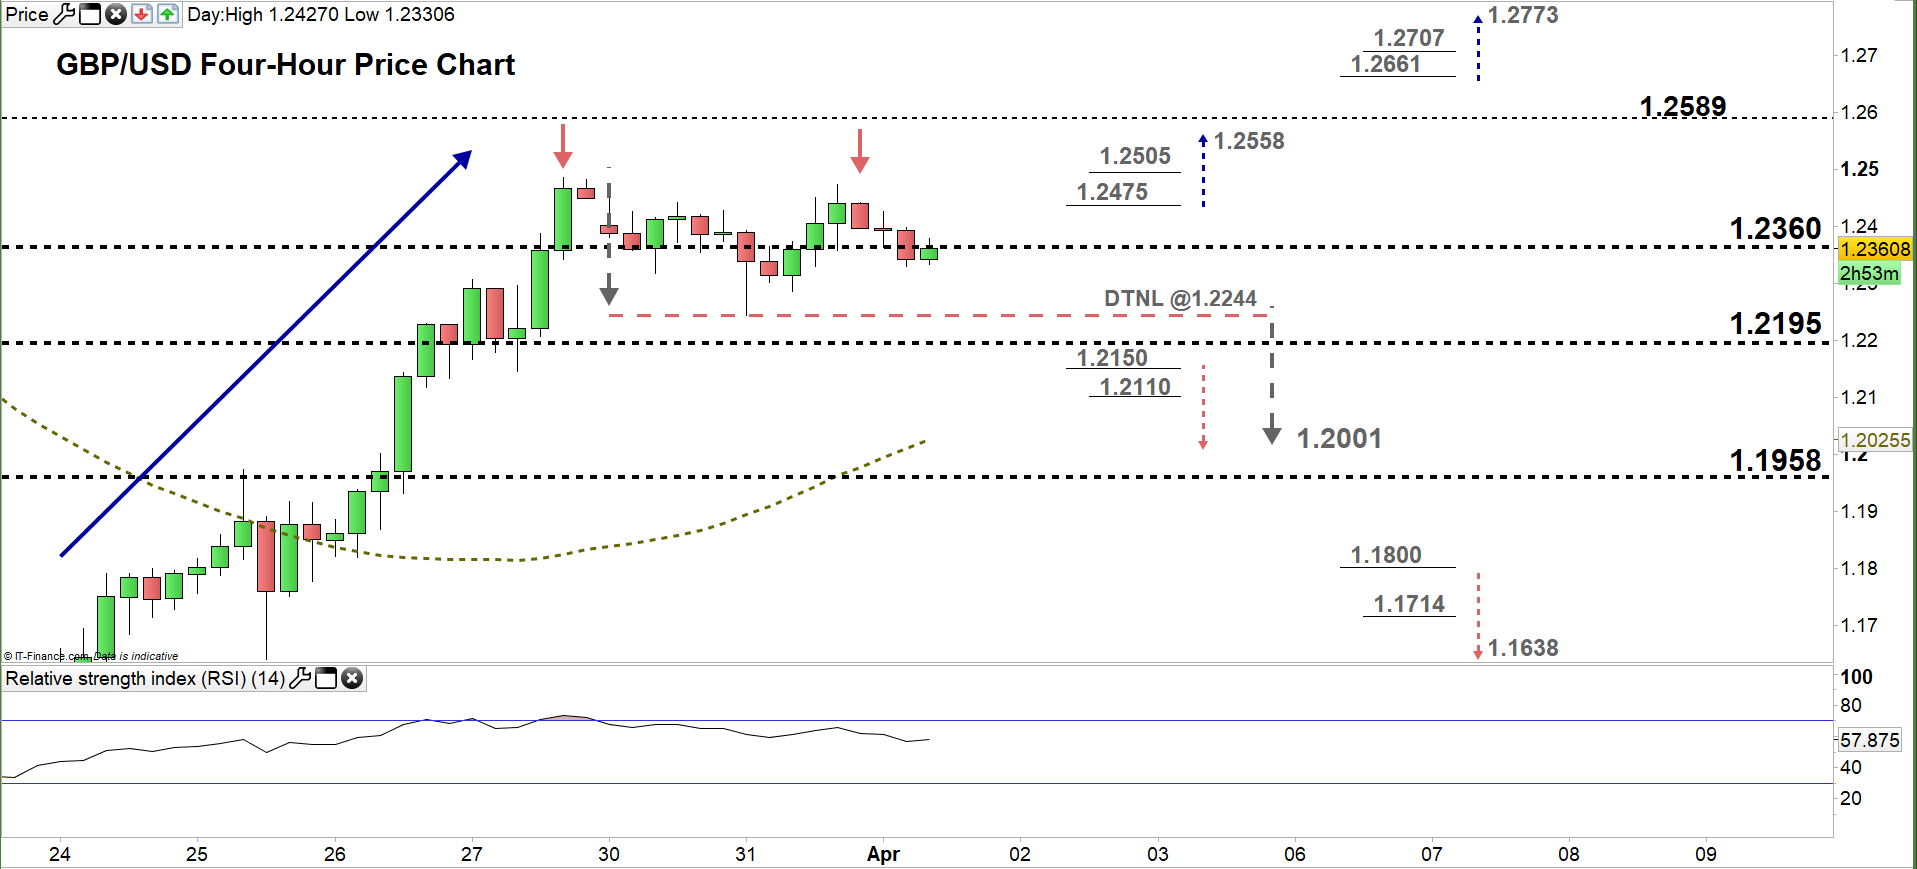
Looking at the four-hour chart, we noticed that on Wednesday GBP/USD broke above the March 20 high at 1.1935 and started uptrend move creating higher highs with higher lows.
However, this week Cable paused its uptrend move and developed a double top (reversal pattern). Thus, any violation of the neckline located at 1.2244 could send the price towards 1.2000 threshold.
A break below 1.2150 would be considered as an additional bearish signal. This may increase the likelihood for GBPUSD to test 1.2000 threshold. Although, the daily support level underlined on the chart should be considered. On the other hand, any break above the second top of the double top pattern would negate this formation. Thus, a break above 1.2475 may cause a rally towards 1.2558. Nevertheless, the weekly resistance level printed on the chart should be watched closely.
See the chart to find out more about key levels Cable would encounter in a further bearish /bullish scenario.

Written By: Mahmoud Alkudsi
Please feel free to contact me on Twitter: @Malkudsi


