


GBP/USD Price Technical Outlook
- British pound price action against US Dollar
- Will GBP/USD surge above 1.3200 handle?
GBP/USD Price – The Indecision Continues
Since the start of this year, GBP/USD has begun a trendless move creating higher lows with lower highs and closing the weekly candlesticks with Doji patterns signaling the market’s indecision at this stage.
Last week, Cable rallied to 1.3175 – its highest level in over two weeks. However, the market retreated from that levels and settled below 1.3100 handle.
This week, the Relative Strength Index (RSI) dipped below 50 then remained flat highlighting weak bears and weaker bulls.
GBP/USD DAILY PRICE CHART (April 25, 2018 – Jan 29, 2020) Zoomed out
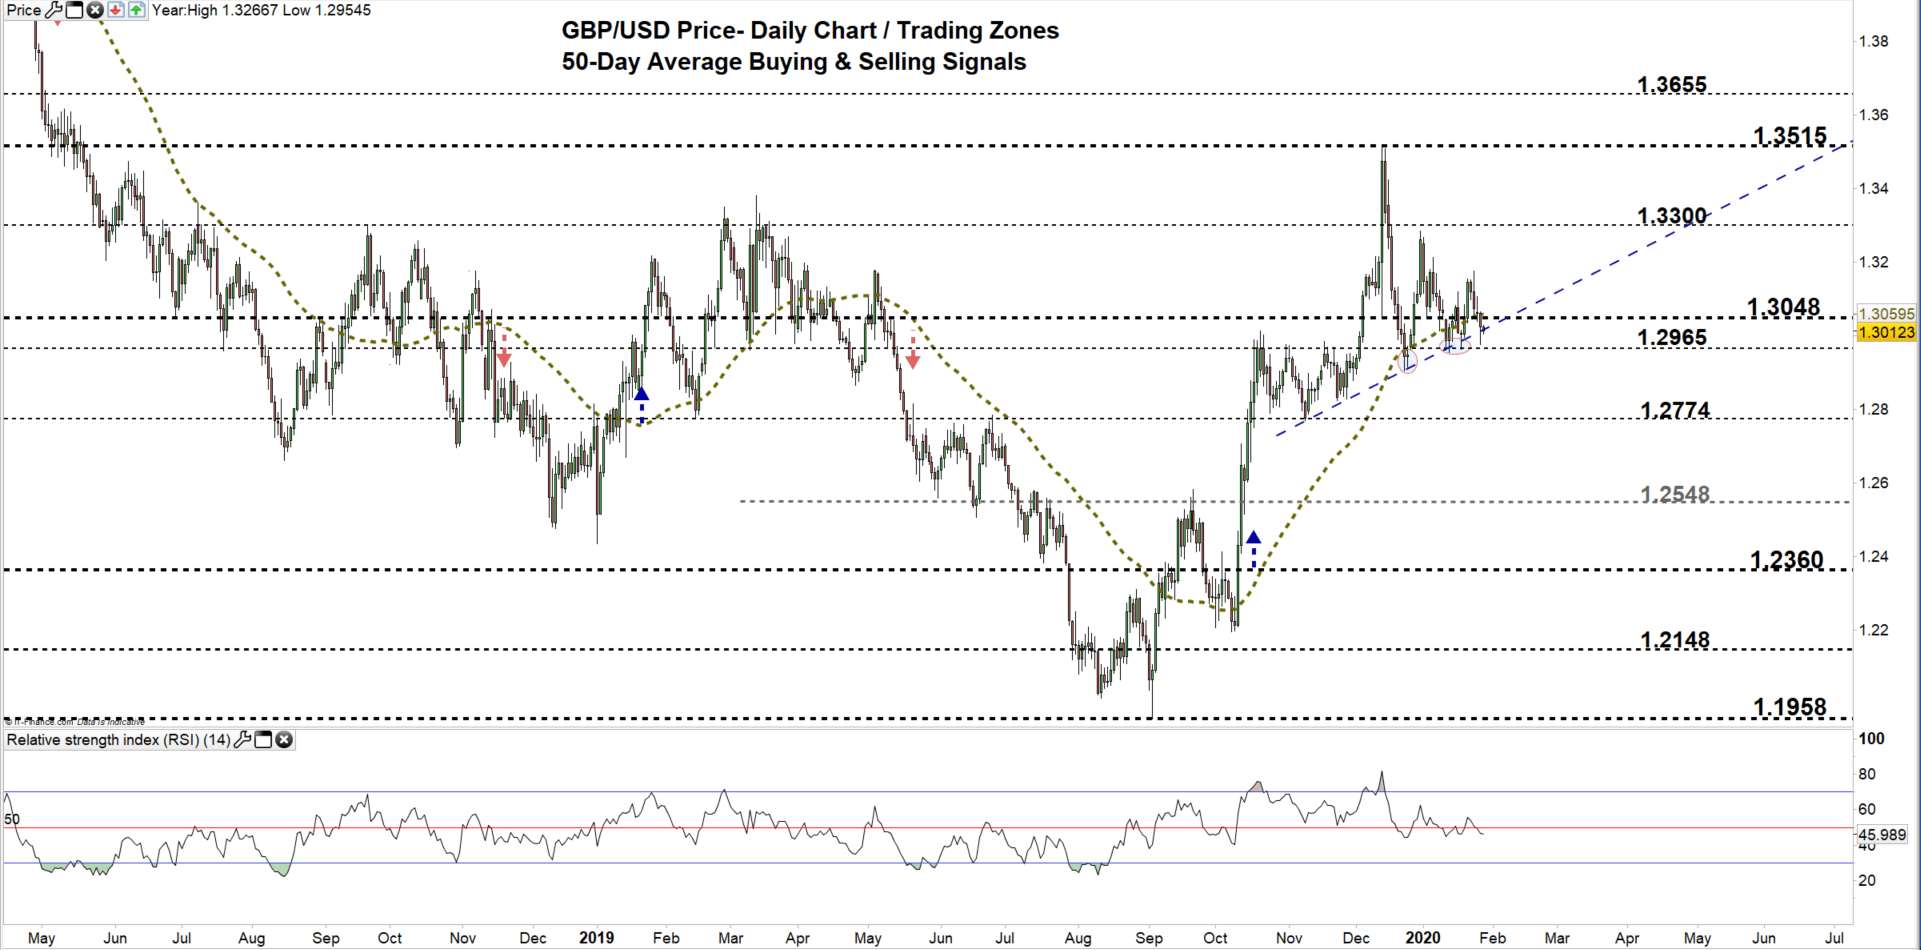

GBP/USD DAILY PRICE CHART (SEP 25 – Jan 29, 2020) Zoomed IN

From the daily chart, we noticed that on Friday GBP/USD closed below the 50-Day average providing a bearish signal. Yesterday, Cable reverted back to the lower trading zone 1.2965 – 1.3048 generating another bearish signal.
That said, a close below the low end of the zone may be required for bears to take charge. This could entice them to lead the market towards 1.2774. Yet, the weekly support levels and area marked on the chart should be considered.
In turn, a close above the high end of the zone could encourage bulls to rally GBPUSD towards 1.3300. Further close above this level may convince more bulls to join push towards 1.3515. In that scenario, the weekly resistance levels printed on the chart would be worth monitoring as some traders might join/exit the market around these points.

GBP/USD Four Hour PRICE CHART (DEC 23 – Jan 29, 2020)
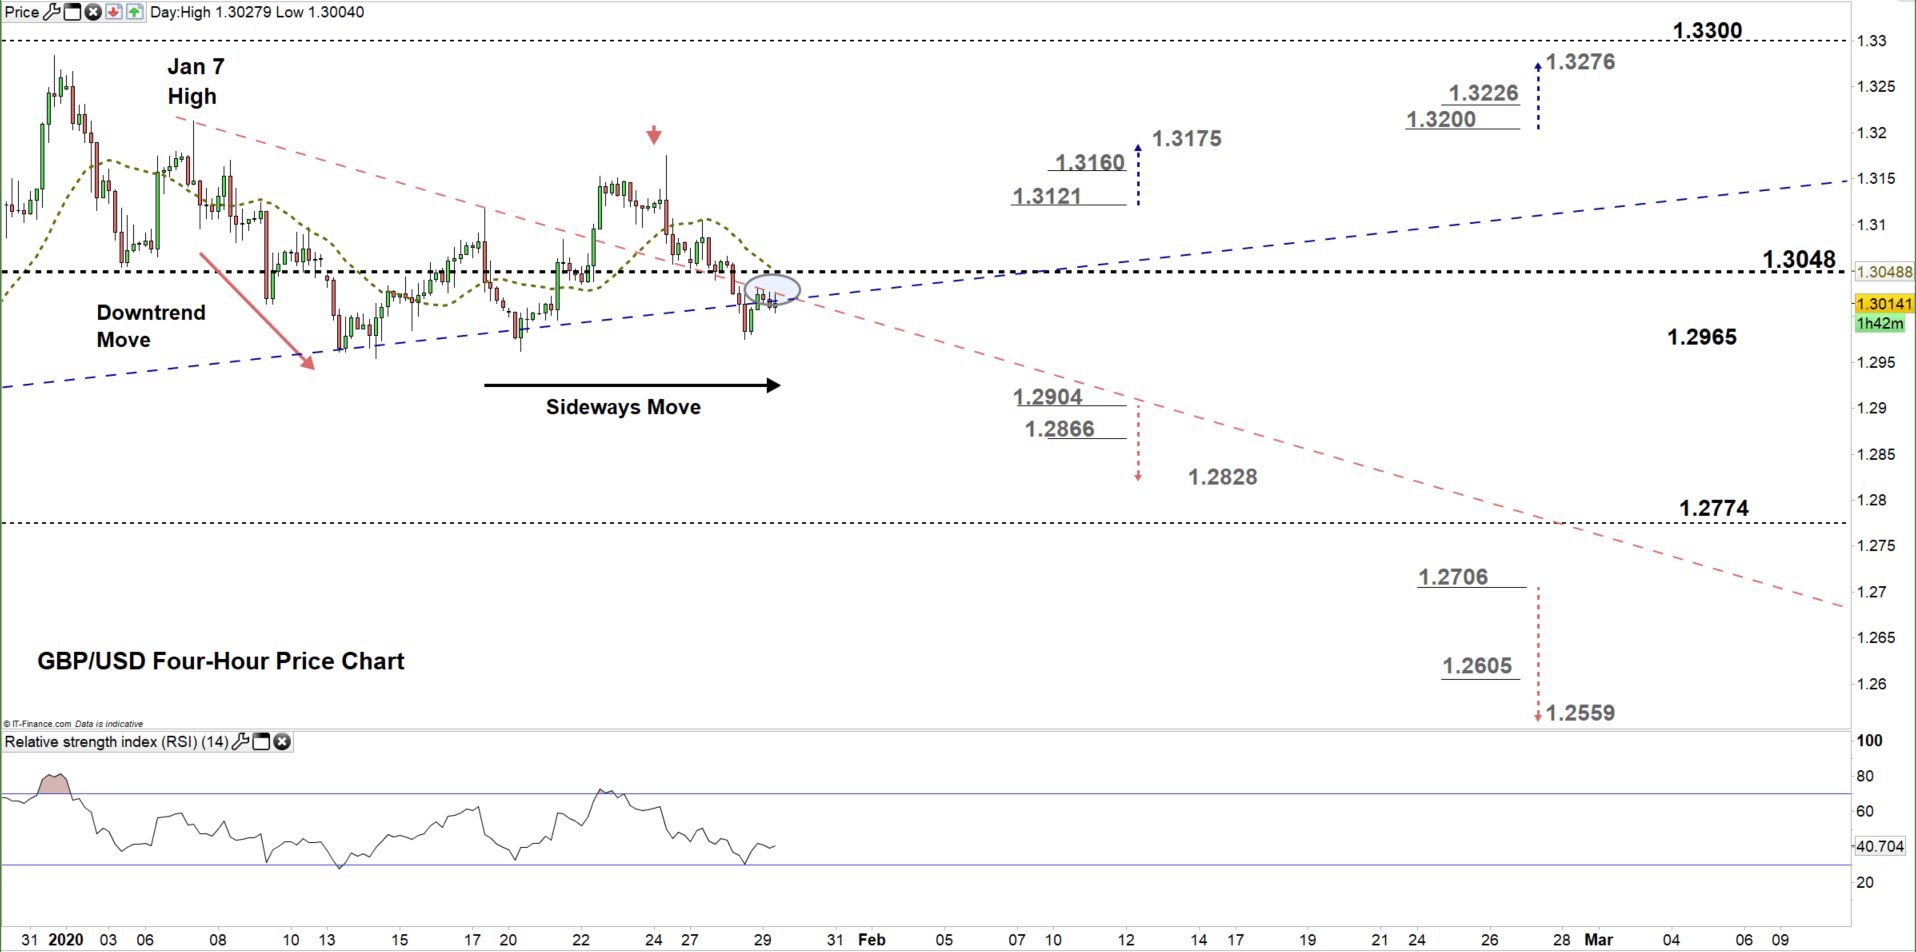
Looking at the four-hour chart, we notice that on Jan 8 started a downtrend move carving out lower highs with lower lows. However, on Jan 15 Cable corrected higher as created a higher low at 1.2984 then stuck in a sideways move. Yesterday GBP/USD broke below the downtrend line originated from the Jan 7 high at 1.3212. Since then, Cable has failed in multiple occasions to overtake this line.
A break below 1.2904 could send GBPUSD towards 1.2828. Yet, the weekly support level underlined on the chart should be kept in focus. On the flip side, a break above 1.3121 may cause a rally towards 1.3185. Nevertheless, the daily resistance underscored on the chart should be watched closely.
See the chart to find out more about key levels Cable would encounter in a further bearish /bullish scenario.
Written By: Mahmoud Alkudsi
Please feel free to contact me on Twitter: @Malkudsi


