


GBP/USD Technical Outlook
- British Pound price action against US Dollar.
- Cable chart and analysis
GBP/USD Price – No One in Control
Last week, GBP/USD repeated the previous week's scenario i.e. a rally then buyer's pull back ending the week with another Doji pattern. This week, Cable rebounded from 1.2954 -its lowest level in three weeks. With this, sellers missed out on an opportunity to lead the price. This resulted in a continuation of current market's indecision.
The Relative Strength Index (RSI) remained flat below 50 highlighting weak sellers and weaker buyers.
Just getting started? See our Beginners’ Guide for FX traders
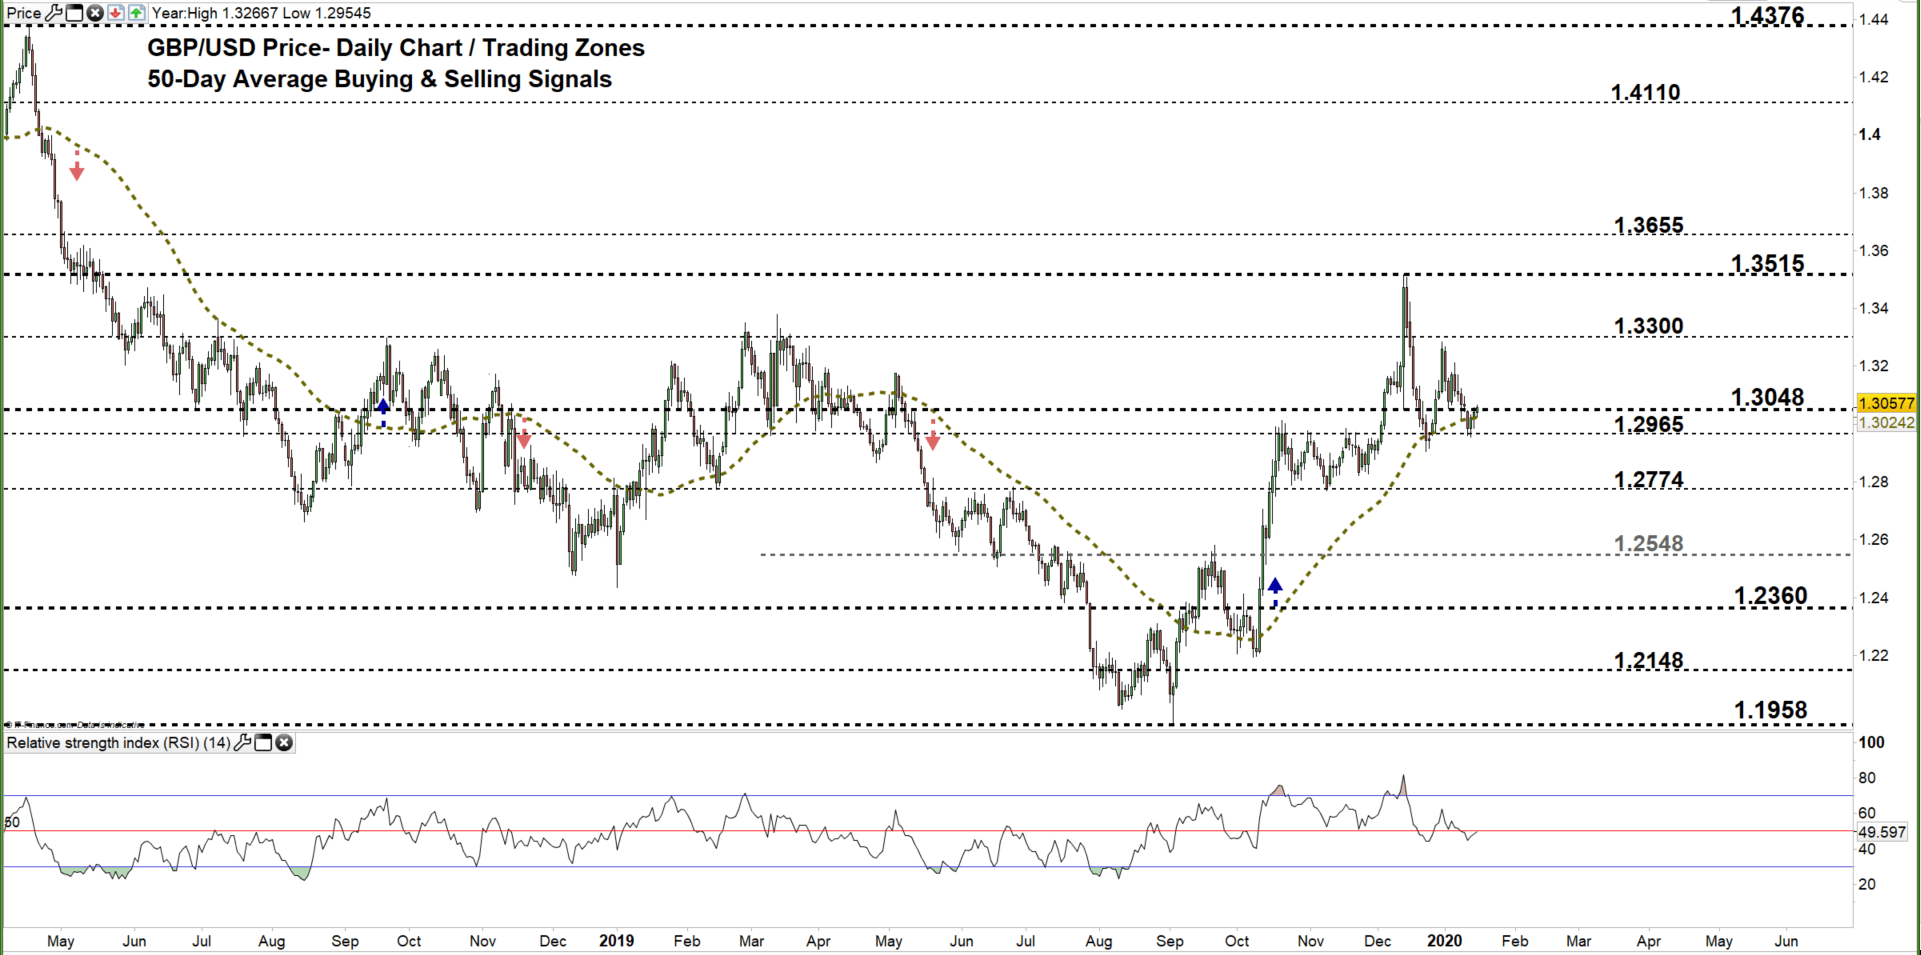
GBP/USD DAILY PRICE CHART (April 25, 2018 – Jan 16, 2020) Zoomed out

GBP/USD DAILY PRICE CHART (Oct 15 – Jan 16, 2020) Zoomed IN
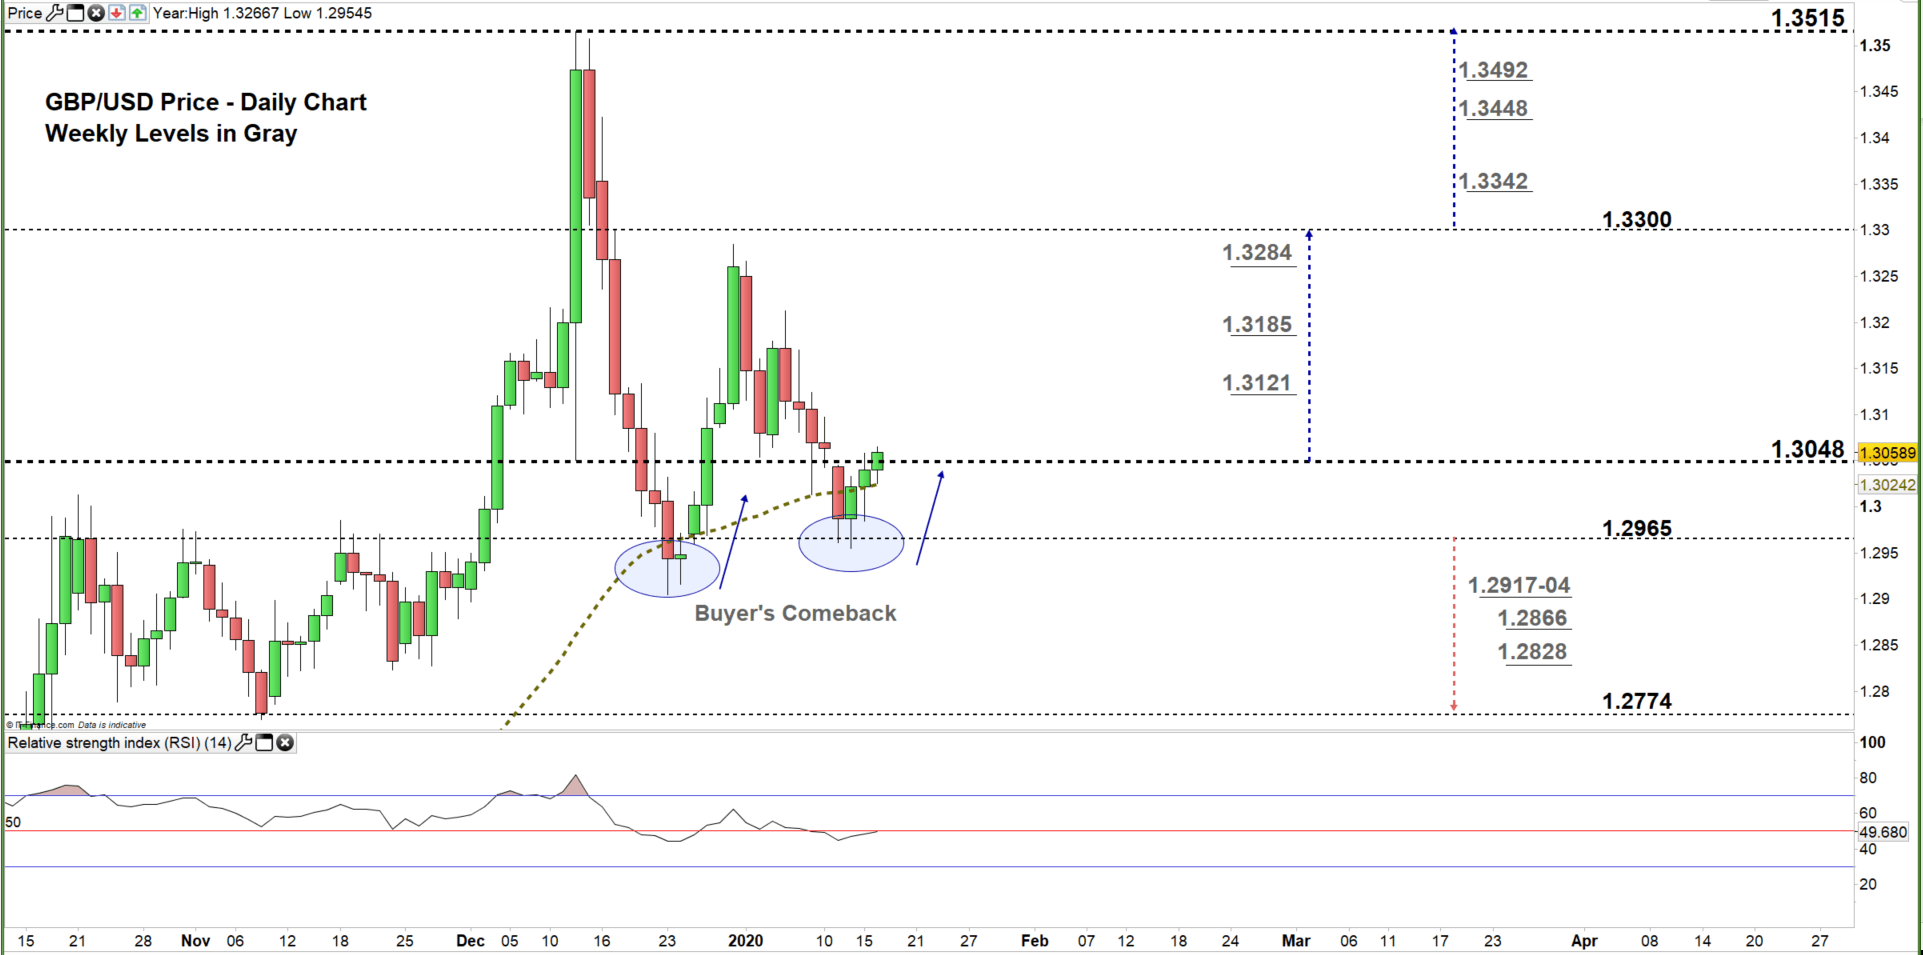
From the daily chart, we notice on Dec 23 GBP/USD rallied back to the old zone indicating that buyers were not done. Similar thing happened this week as the price rebounded twice nearby the low end of current trading zone 1.2965 - 1.3048 then closed above the 50-Day average generating an additional bullish signal.
A close above the high end of the zone could pave the way for buyers to lead GBPUSD towards 1.3300 handle contingent on clearing the weekly resistance levels underlined on the chart (zoomed in). Further close above this level may convince more buyers to join the rally and push towards 1.3515. In that scenario, a special attention should be paid to the weekly resistance levels as some traders could join/exit the market nearby these points.
On the other hand, a close below the high end of the zone reflects buyer’s hesitation. This could lead some of them to exit the market and reverse the pair’s direction towards the low end of the zone. Further close below the low end opens the door for sellers to take charge and press Cable towards 1.2774. Although, the weekly support levels and area marked on the chart should be considered.

GBP/USD Four Hour PRICE CHART (DEC 11 – Jan 16, 2020)
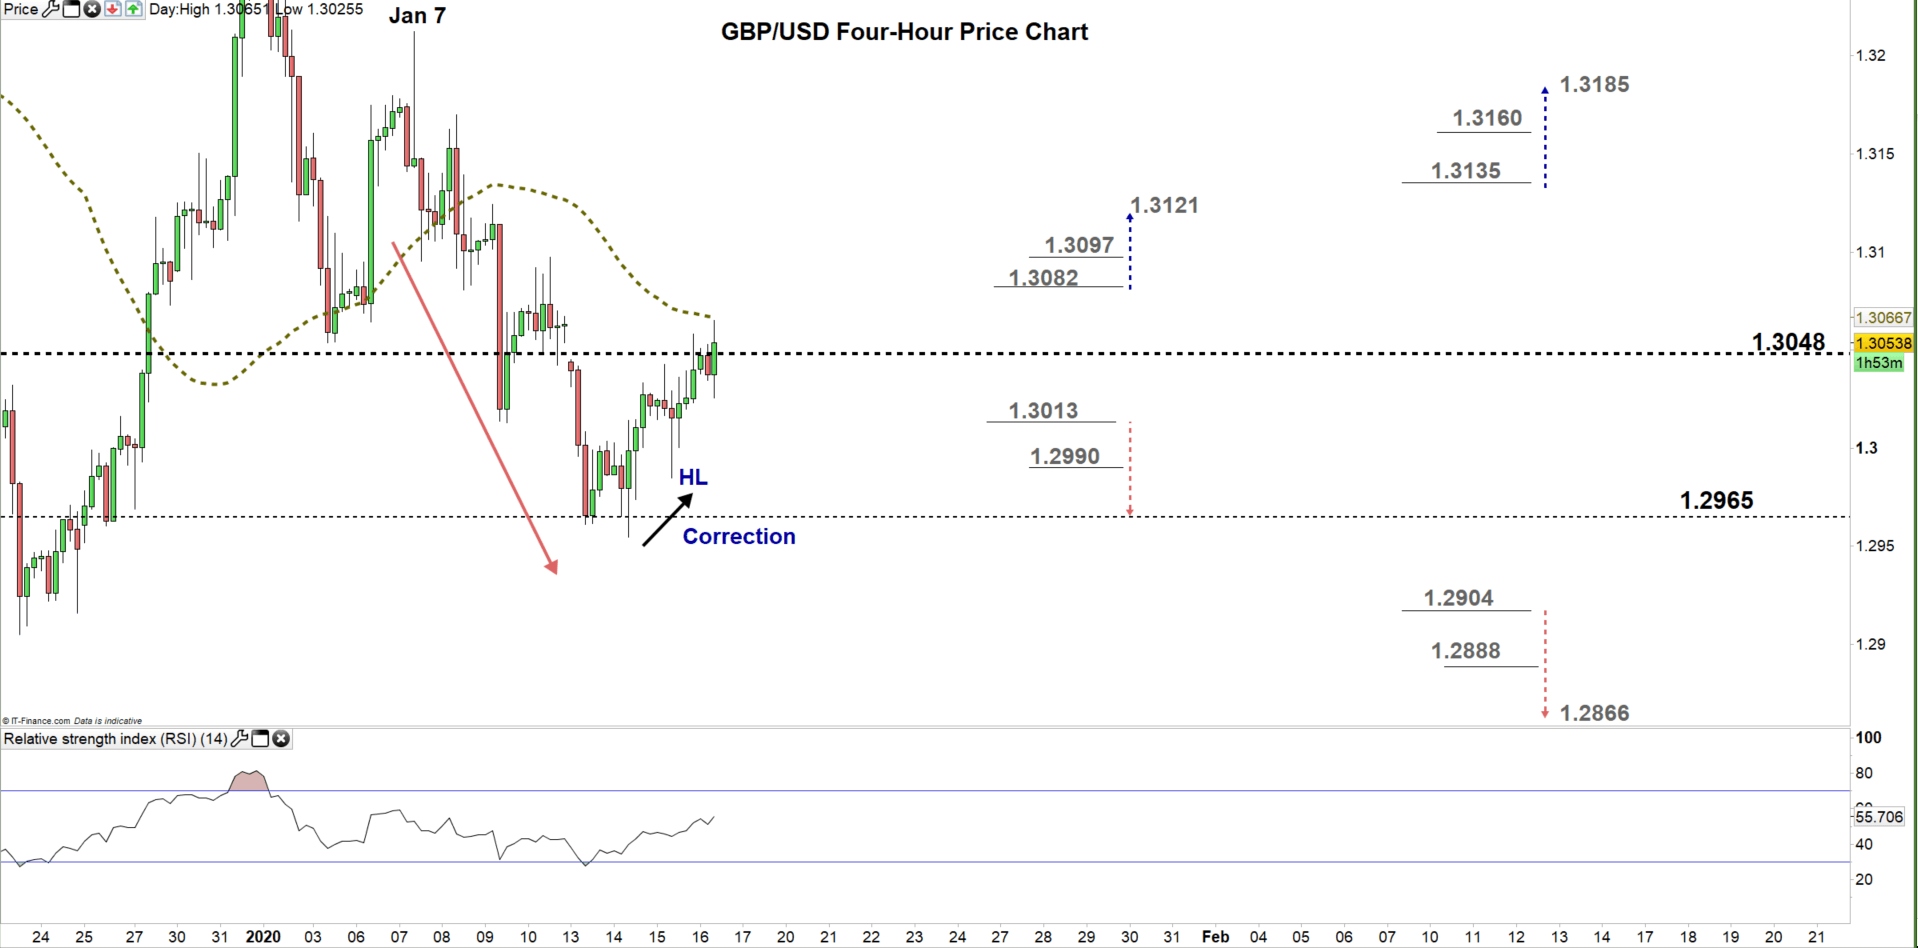
Looking at the four-hour chart, we notice on Jan 7 GBP/USD spiked at 1.3232 then declined after and started a downtrend move creating lower highs with lower lows. Yesterday, the pair corrected higher as created a higher low at 1.2984.
A break above 1.3082 could push GBPUSD towards 1.3121. Yet, the daily resistance level underlined on the chart should be kept in focus. On the flip side, a break below 1.3013 may lead the price towards the low end of current trading zone discussed above on the daily chart.
See the chart to find out more about key levels Cable would encounter in a further bearish /bullish scenario.
Having trouble with your trading strategy? Here’s the #1 Mistake That Traders Make
Written By: Mahmoud Alkudsi
Please feel free to contact me on Twitter: @Malkudsi


