


GBP/USD Technical Analysis
- British Pound price action against US Dollar.
- GBP/USD charts and analysis
Download for free our latest Q4 trading guides to help you build confidence when you trade on JPY, USD and other main currencies
Weaker Bullish Impulse
On Oct 21, GBP/USD peaked at 1.3013 – its highest level in over five months. Since then, the uptrend momentum have stalled, reflecting buyer’s reluctance at this stage.
Alongside this, the Relative Strength Index (RSI) climbed above 70 however, the oscillator could not remain in overbought territory, highlighting a weakened uptrend move.
Just getting started? See our Beginners’ Guide for FX traders
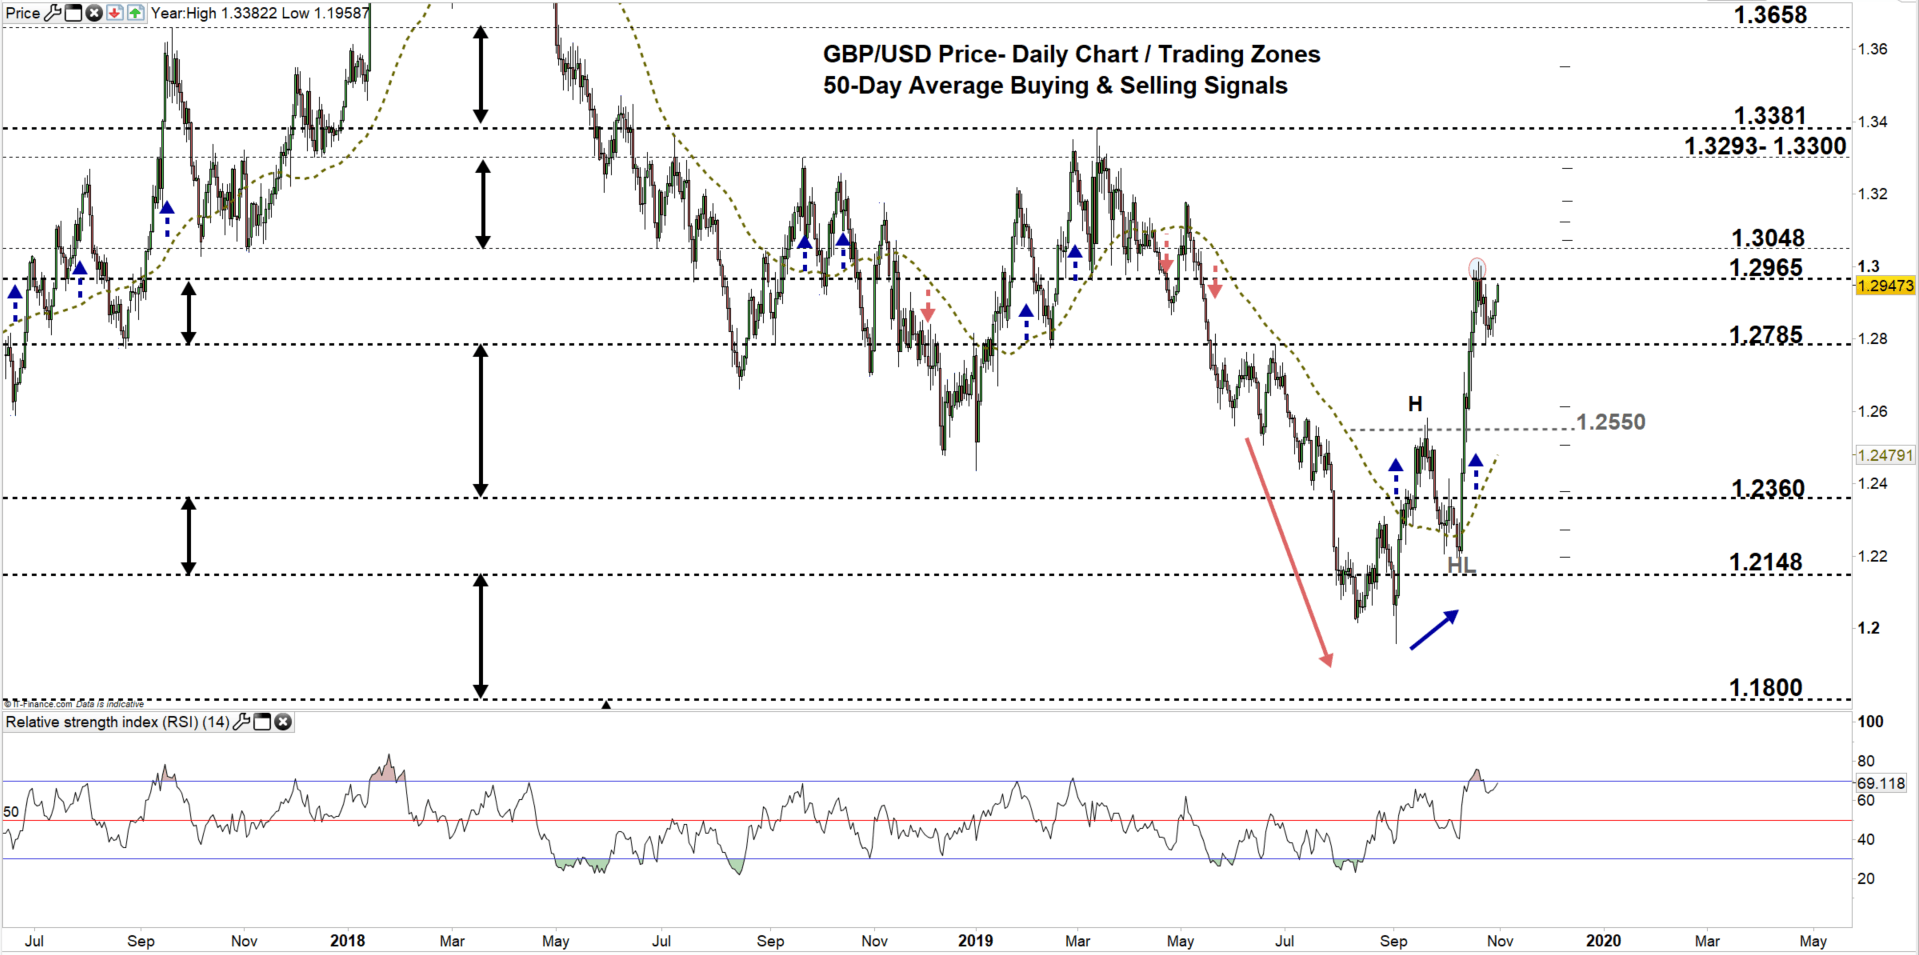
GBP/USD DAILY PRICE CHART (June 15, 2017 – Oct 31, 2019) Zoomed out
GBP/USD DAILY PRICE CHART (June 10 – Oct 31, 2019) Zoomed IN
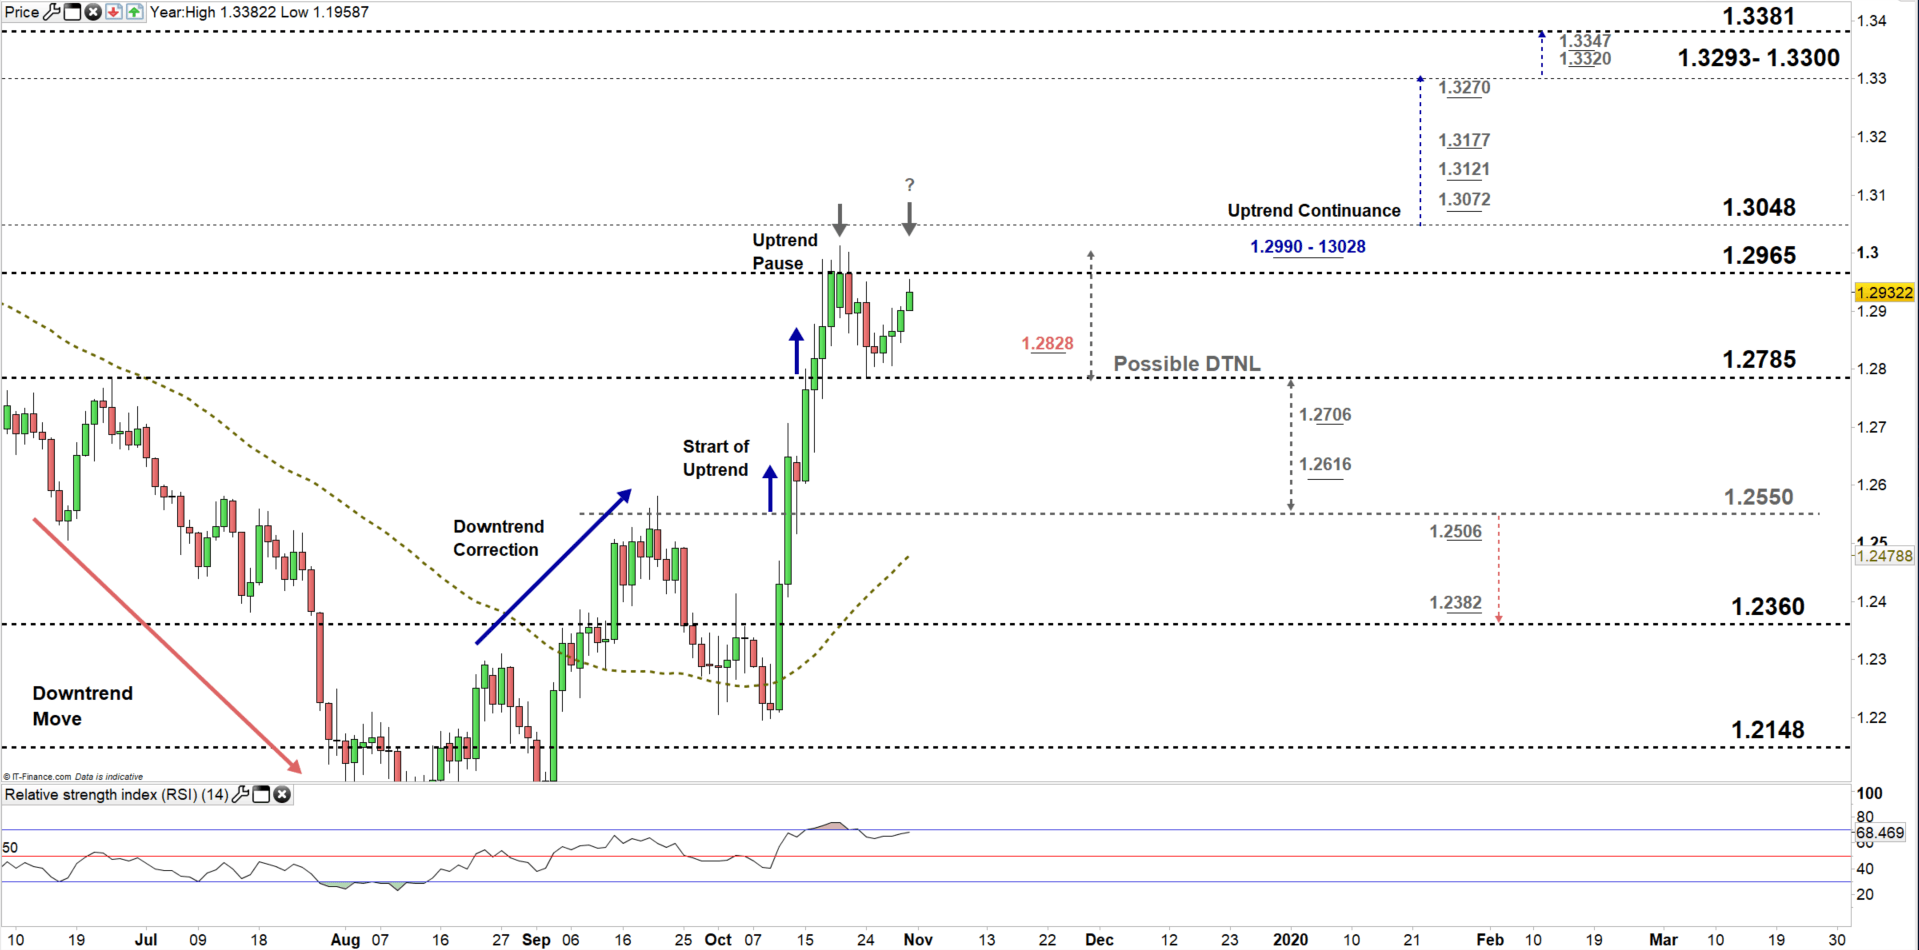
From the daily chart, we notice on Oct 16, GBP/USD moved to a higher trading zone 1.2785- 1.2965. The uptrend move stayed intact after seller's failure in forcing a close below the low end of the zone on Oct 24. Since then, the price have rallied eying a test of the high end of the zone.
Thus, a close above the high end of the zone may embolden buyers to push GBPUSD towards 1.3048. Further close above this level could resume bullish price action towards the vicinity of 1.3293 -1.3300. Nevertheless, the daily and weekly area and levels marked on the chart (zoomed in) should be kept in focus.
On the other side, a rebound and a close below the high end of the zone could reverse the price direction towards the low end, creating a double top pattern where the neckline is located at 1.2785. Further close below the neckline, could correct the price lower towards 1.2550. Having said that, the daily and weekly support levels underlined on the chart should be watched closely.
Having trouble with your trading strategy? Here’s the #1 Mistake That Traders Make
GBP/USD Four Hour PRICE CHART (Oct 8 – Oct 31, 2019)
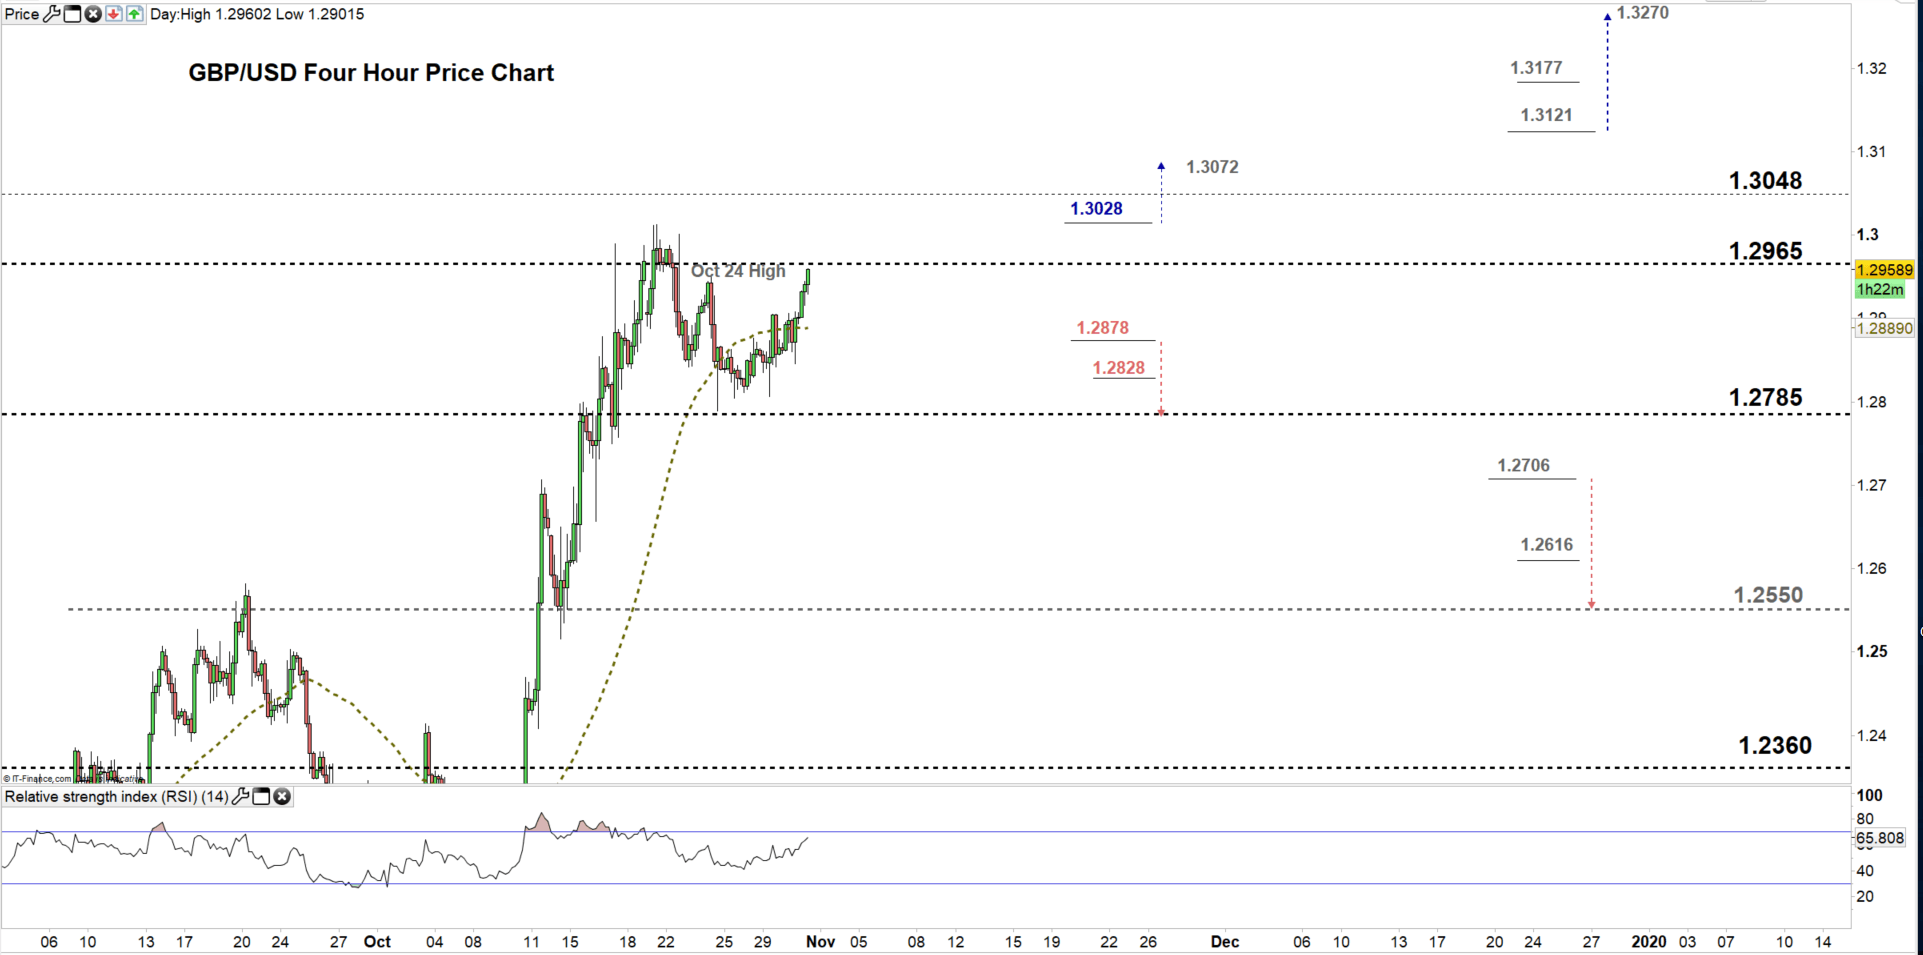
Looking at the four-hour chart, we notice today GBP/USD broke above Oct 24 high eyeing a test of the 1.3000 handle. Therefore, a break above 1.3028 could push GBPUSD towards 1.3072. Although, the weekly resistance level at 1.3048 should be considered.
On the flip-side, a break below 1.2878 could press GBPUSD towards the low end of the aforementioned trading zone. However, the daily support level underlined on the chart would be worth monitoring.
See the chart to find out more about key levels GBPUSD would encounter in a further bearish /bullish scenario.
Written By: Mahmoud Alkudsi
Please feel free to contact me on Twitter: @Malkudsi


