


GBPUSD Talking Points:
- It’s been a very strong second-half of February for the British Pound, as a mid-month support test in the 1.2800 area has yielded to a strong pace of gains that’s seen prices move up to as high as 1.3350.
- At the source of the move is diminishing pessimism around Hard-Brexit or No-Deal Brexit options. This has driven RSI on the Daily Chart of GBPUSD into overbought territory, which has generally been a bearish factor for the pair in the post-Brexit backdrop. But – (a dangerous question of) is this time different given the softening tone around Hard-Brexit?
- DailyFX Forecasts are available on a variety of currencies such as the US Dollar or the Euro and are available from the DailyFX Trading Guides page. If you’re looking to improve your trading approach, check out Traits of Successful Traders. And if you’re looking for an introductory primer to the Forex market, check out our New to FX Guide.
Do you want to see how retail traders are currently trading the US Dollar? Check out our IG Client Sentiment Indicator.
At that half-way marker for this week it’s already been a big outing for the British Pound. The currency has so far gained each day of the week, but what’s perhaps most significant is the size of the jump and the levels that have been traded through. GBPUSD has rallied from a Friday low of 1.2968 for a re-test of the 1.3350 level, taking out the 1.3000 psychological level and a number of prior highs and Fibonacci levels along the way.
At the source of the move is diminishing pessimism around Hard Brexit or No-Deal Brexit options. As has been covered by our UK-based DailyFX Analysts over the past couple of days, Brexit has been on centerstage. Nick Cawley discussed this yesterday, looking at how a lower likelihood of a No-Deal Brexit stole the headlines from the Bank of England’s testimony in-front of the Treasury Select Committee. Martin Essex followed that up earlier this morning, focusing-in on the overnight price movement in the aftermath of yesterday’s breakout. And for forward-looking information, Justin McQueen laid out the key amendments to be voted on by British MP’s.
On the Daily chart below, RSI shows a recent move into overbought territory as this week’s rally has extended a topside run that began in the middle of February. The last time RSI made a trip to the 70 level was in late-January, just before a 400+ pip sell-off.
GBPUSD Daily Price Chart
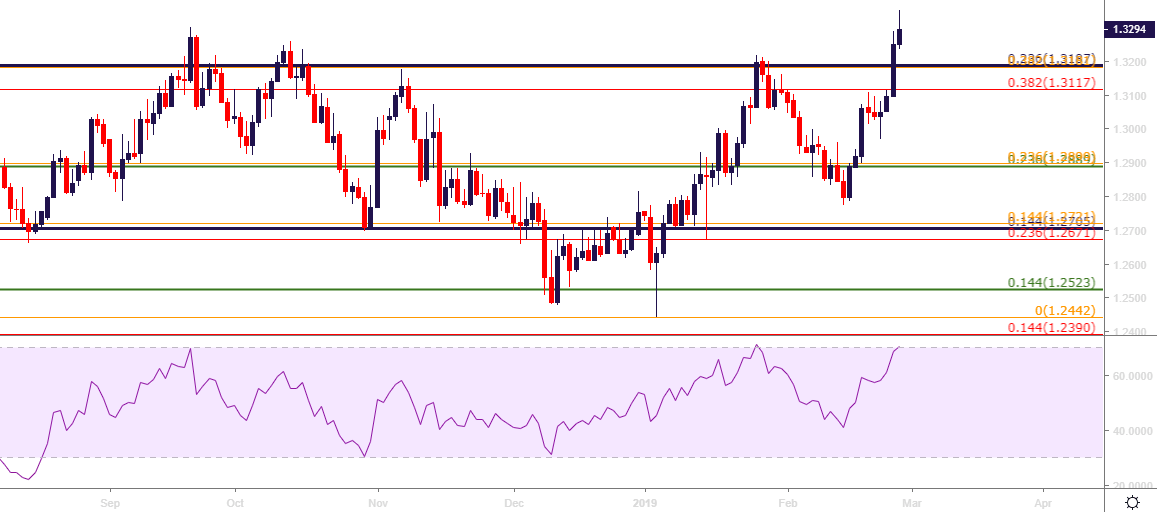
Chart prepared by James Stanley
GBPUSD Moving Forward
The big question around the British Pound at the moment is whether bulls might have some space to roam for a while. While overbought readings have been a generally bearish factor in GBPUSD price action in the post-Brexit period, the fact that hope is in the headlines and the prospect of a No-Deal Brexit looks less likely could potentially produce a new trend that may have some lasting impact. At the very least, there’s another reason for longer-term shorts to cover positions, and this could continue to drive the topside move.
But traders should continue to treat GBP-markets with extreme caution, as headline-drive themes can turn-on-a-dime, and that could create price movements just as sharp, if not more so, on the way down than what was seen on the way up.
For shorter-term themes and for traders looking at bullish continuation strategies, the pace with which the recent move has priced-in complicates support identification because, simply, there hasn’t been much slowing in this week’s advance. Nearby is a potential zone from 1.3231 up to the psychological level at 1.3250; as the former of those prices helped to set a prior swing-high that later showed up as swing-low support. A bit-lower is a confluent Fibonacci zone around the 1.3181-1.3187 area; and below that is the 1.3087-1.3117 support zone. If prices are unable to hold above this week’s low of 1.3049, the bullish theme should come under review as something has likely shifted in the backdrop.
GBPUSD Hourly Price Chart
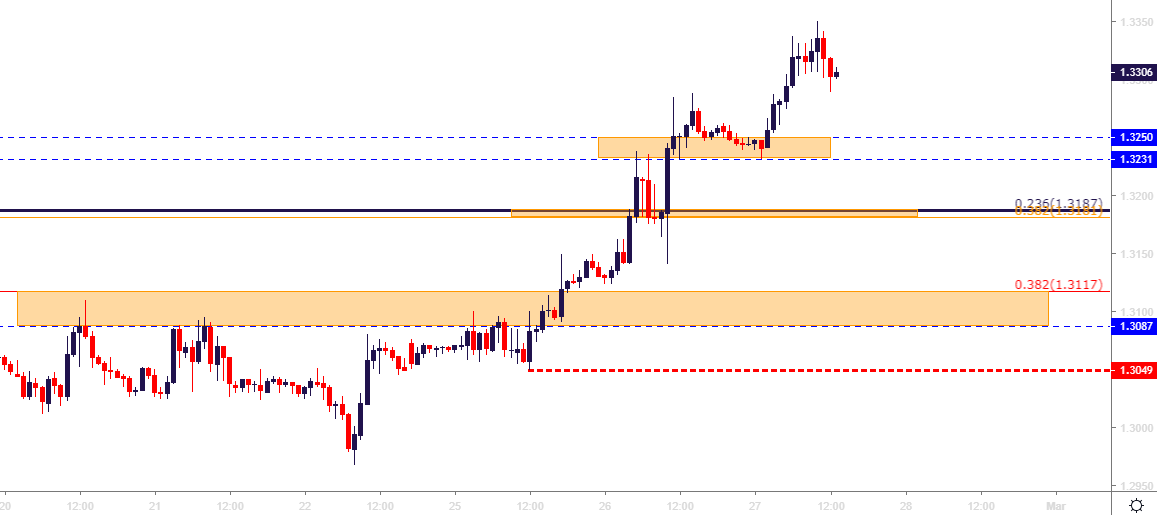
Chart prepared by James Stanley
GBPUSD Breakout Strategies
For traders that do want to look for brute-force continuation of the recent bullish breakout, a series of potential resistance levels sitting above the current high could be incorporated as targets or markers for stop movements. At 1.3409 is the 50% marker of the 2018 sell-off in the pair, and a bit-higher is a rather imposing area of resistance potential around the 1.3500-handle. There is a confluent of Fibonacci levels sitting inside of the psychological level, and that appears to be an area of turbulence for bullish approaches should this current theme test in that area.
GBPUSD Daily Price Chart
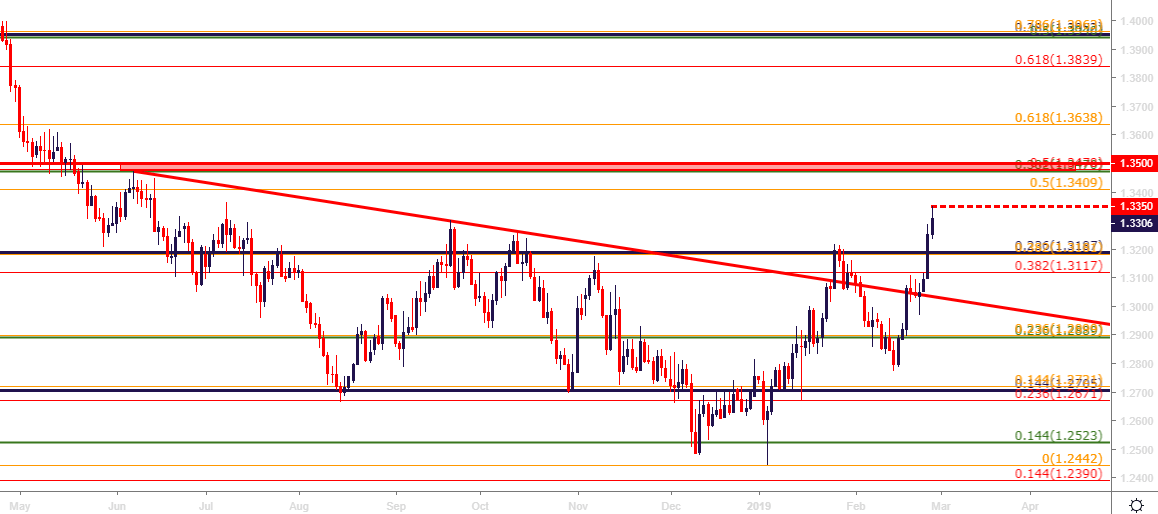
Chart prepared by James Stanley
To read more:
Are you looking for longer-term analysis on the U.S. Dollar? Our DailyFX Forecasts for Q1 have a section for each major currency, and we also offer a plethora of resources on USD-pairs such as EUR/USD, GBP/USD, USD/JPY, AUD/USD. Traders can also stay up with near-term positioning via our IG Client Sentiment Indicator.
Forex Trading Resources
DailyFX offers a plethora of tools, indicators and resources to help traders. For those looking for trading ideas, our IG Client Sentiment shows the positioning of retail traders with actual live trades and positions. Our trading guides bring our DailyFX Quarterly Forecasts and our Top Trading Opportunities; and our real-time news feed has intra-day interactions from the DailyFX team. And if you’re looking for real-time analysis, our DailyFX Webinars offer numerous sessions each week in which you can see how and why we’re looking at what we’re looking at.
If you’re looking for educational information, our New to FX guide is there to help new(er) traders while our Traits of Successful Traders research is built to help sharpen the skill set by focusing on risk and trade management.
--- Written by James Stanley, Strategist for DailyFX.com
Contact and follow James on Twitter: @JStanleyFX


