


To receive Ilya's analysis directly via email, please SIGN UP HERE
Talking Points:
- GBP/USD Technical Strategy: Flat
- Support: 1.5166, 1.4980, 1.4750
- Resistance: 1.5322, 1.5551, 1.5737
The British Pound stalled after correcting lower from the top of a falling channel encapsulating the down move against the US Dollar since mid-September. Near-term trend line resistance-turned-support is at 1.5166, with a break below that on a daily closing basis exposing the 23.6% Fib expansion at 1.4980. Alternatively, a move above the intersection of channel top resistance and the 23.6% retracement at 1.5322 opens the door for a challenge of the 38.2% threshold at 1.5551.
Positioning is inconclusive at this point, with prices offering no clear-cut and actionable signal to initiate a long or short trade. We will continue to remain on the sidelines for the time being, waiting for a compelling opportunity to present itself.
Add these technical levels directly to your charts with our Support/Resistance Wizard app!
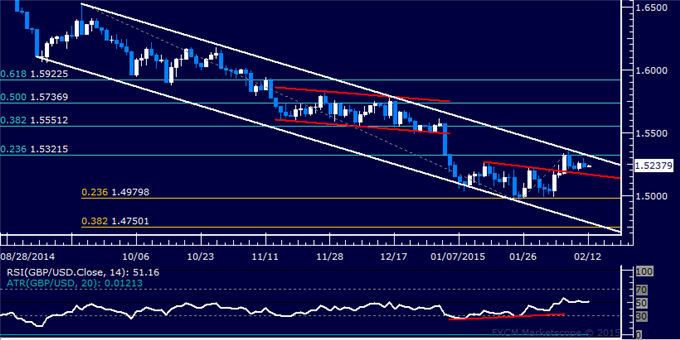
Daily Chart - Created Using FXCM Marketscope
--- Written by Ilya Spivak, Currency Strategist for DailyFX.com


