


GBP/JPY Price- Technical Outlook
GBP/JPY- Bears Take Charge
On June 16, GBP/JPY corrected its upward trend and created a lower high at 136.35 indicating that bulls were losing momentum. Later on, the price declined further and closed the weekly candlestick in the red with a 2.0% loss.
The accelerating coronavirus cases in the United States and elsewhere knocked confidence in a rapid economic recovery and drove investors away from riskier currencies.
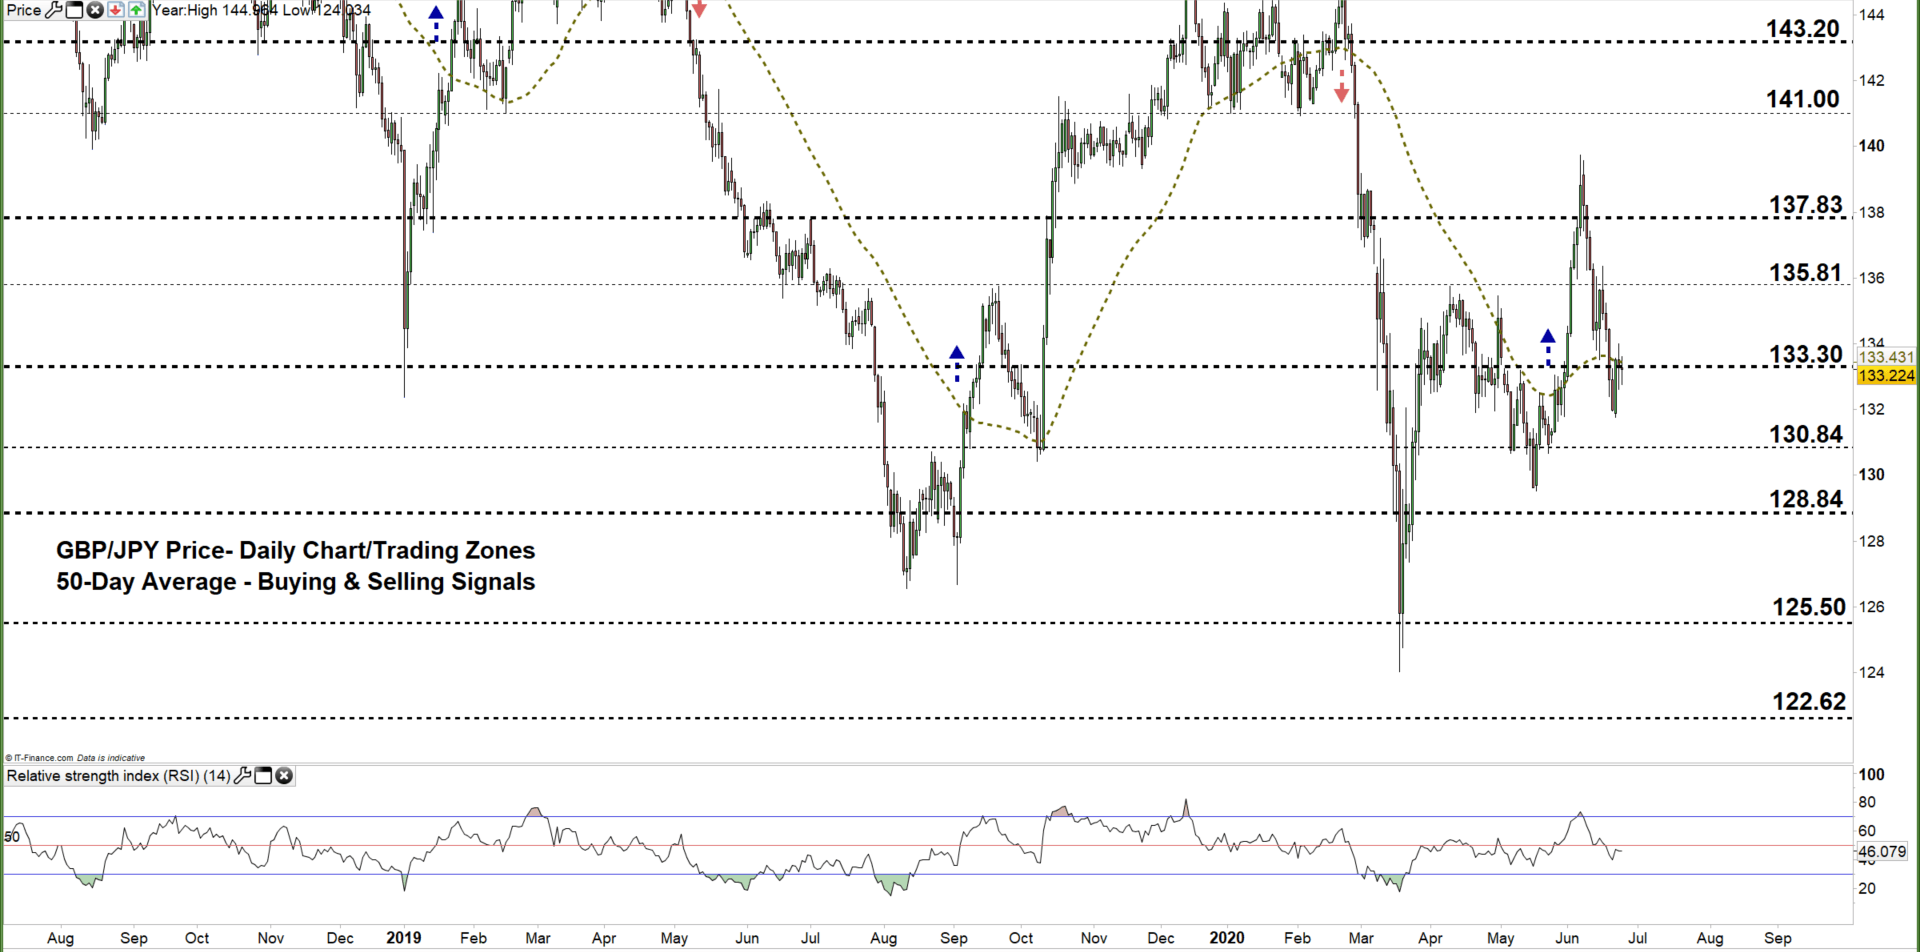
GBP/JPY Daily PRice CHART ( July 18, 2018 – June 24, 2020) Zoomed Out
GBP/JPY Daily PRice CHART (March 26 – June 24, 2020) Zoomed In
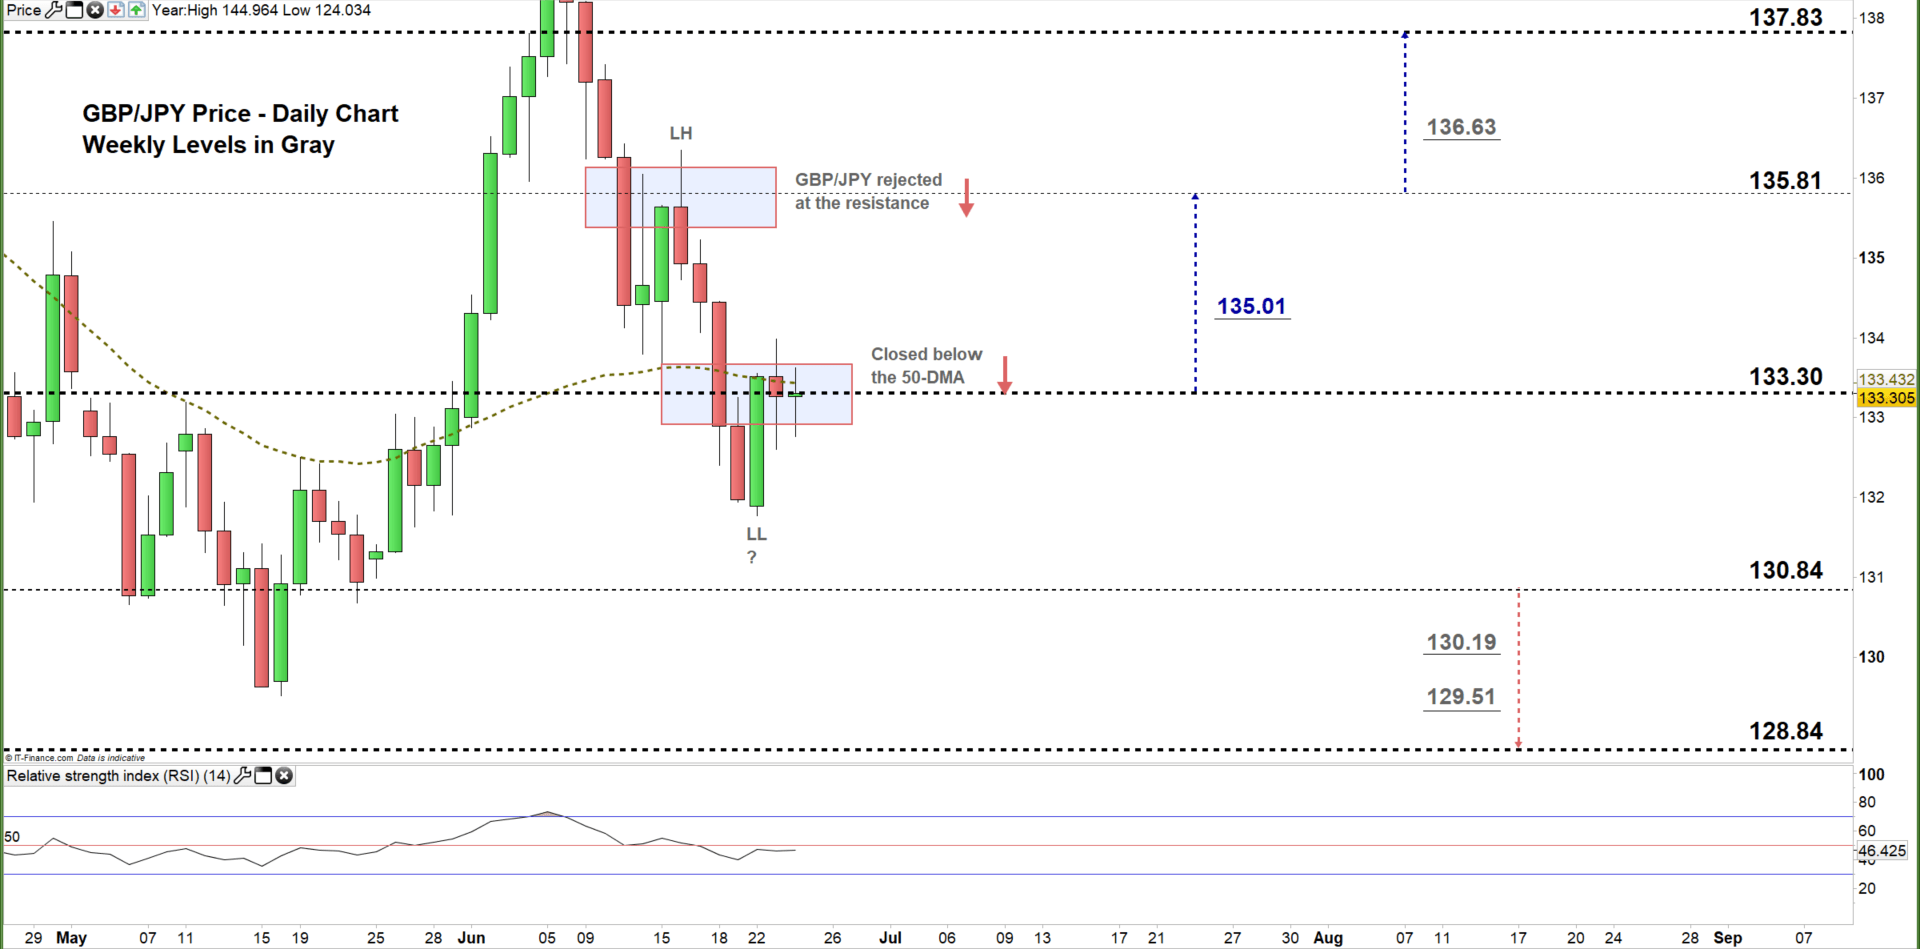
On Thursday, GBP/JPY closed below the 50-day moving average highlighting that bears were in charge. On Monday the price declined to an over three-week low at 131.77. However, the market rallied after as some bears seemed to cover.
Yesterday, the pair retreated to the current trading zone 130.84 – 133.30 indicating that bearish momentum was still intact. Another close below the high end of the zone could encourage bears to press towards the low end of the zone. Any further close below that level could send GBPJPY even lower towards 128.84.
On the other hand, a close above the high end of the zone reflects the bear's hesitation and may cause a rally towards 135.81. Any further close above that level could extend the rally towards 137.83.

GBP/JPY Four Hour PRice CHART (May 22 – June 24, 2020)

Last week, GBP/JPY broke and remained below the uptrend line originated from the May 27 low at 131.63, and generated a bearish signal. This week, the price has rallied above this line signaling a weaker bearish sentiment.
Hence, a break above the downtrend line originated from the June 10 high at 137.42 would generate a bullish signal. In turn, any break below the uptrend line originated from the May 22 low at 130.67 would generate a bearish signal.
To conclude, a break below 131.78 could send GBPJPY towards 132.02 while a break above 134.32 may trigger a rally towards 135.39. Nonetheless, the daily and support and resistance underlined on the four-hour chart should be kept in focus.

Written By: Mahmoud Alkudsi,Market analyst
Please feel free to contact me on Twitter: @Malkudsi


