


GBP/JPY Technical Forecast
GBP/JPY- Bulls Gain the Upper Hand
On Friday, GBP/JPY rallied to a four-week high at 133.46 then closed the weekly candlestick in the green with a near 1.9% gain. This week, the market has continued bullish price action and printed 136.26 -its highest level in over two and a half months.
Alongside this, the Relative Strength Index (RSI) has risen this week from 57 to 66 highlighting an accelerating bullish momentum.
GBP/JPY Daily PRice CHART (AUG 8, 2018 – June 2, 2020) Zoomed Out


GBP/JPY Daily PRice CHART (FEB 29 – June 2, 2020) Zoomed In
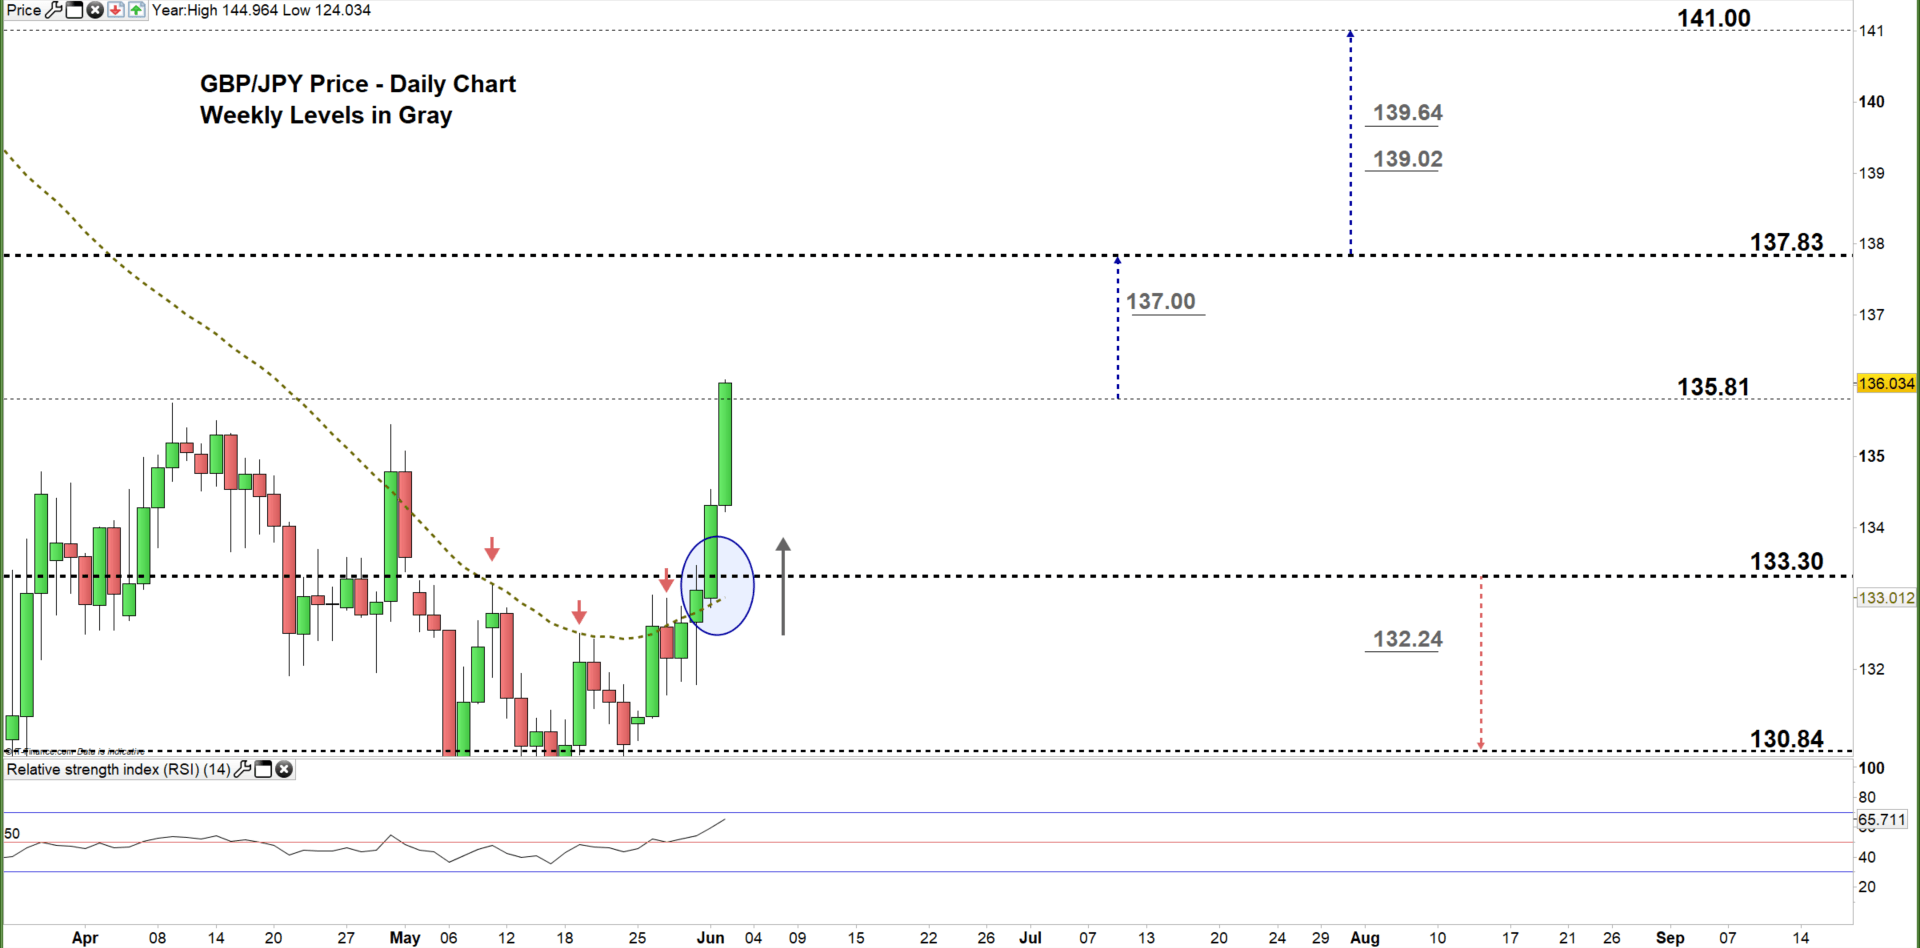
By the end of last week, GBP/JPY closed above the 50-day moving average resistance and signaled a possible start of a bullish move. Yesterday, the price climbed to the current trading zone 133.30 – 135.81 eyeing a test of the high end of it.
A close above the high end of the aforementioned trading zone reflects a stronger bullish sentiment and might cause a rally towards 137.83. A further close above that level may extend the rally towards 141.00.
On the other hand, any failure in closing above the high end of the zone signals bull’s hesitation and may send GBPJPY to 133.30. A further close below that level could send the price even lower towards 130.84.
That being said, the weekly support and resistance levels underlined on the daily chart (zoomed in) should be monitored in both bullish/ bearish scenarios.

GBP/JPY Four Hour PRice CHART (April 29 – June 2, 2020)
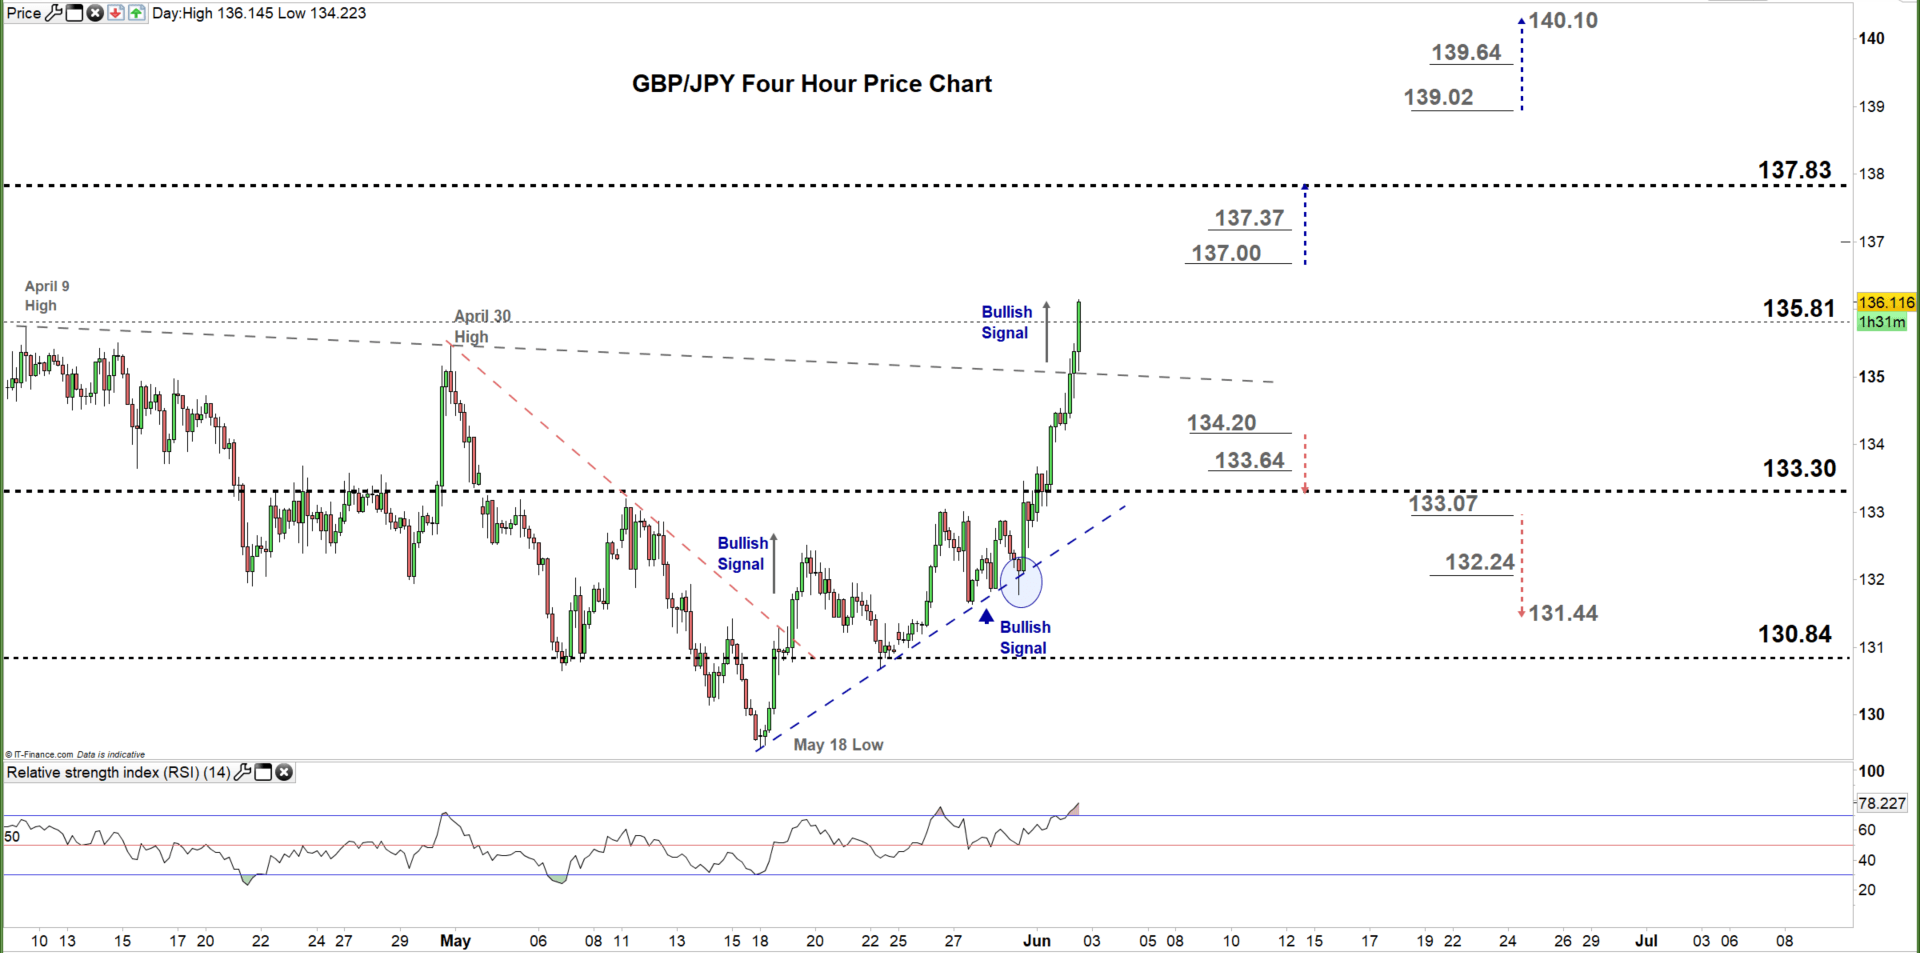
On May 19, GBP/JPY rallied above the downtrend line originated from the April 30 high at 135.45 and generated a bullish signal. Last week, the price respected the uptrend line originated from the May 18 low at 129.51 indicating that bullish momentum was still intact. Today, the pair has violated the downtrend line originated from the April 9 high at 145.75 and produced an additional bullish signal.
A break above the 137.00 handle may encourage bulls to push towards 137.83. In turn, any break in the other direction i.e. below 134.20 could send GBPJPY for a test of the low end of the current trading zone discussed on the daily chart.
Nonetheless, the daily and support and resistance marked on the four-hour chart should be kept in focus.

Written By: Mahmoud Alkudsi,Market analyst
Please feel free to contact me on Twitter: @Malkudsi


