


EUR /JPY and GBP/JPY Technical Analysis
GBP/JPY, EURJPY – Bearish Outlook
Last week, Euro and British pound weakened against Japanese yen. On Friday, EUR/JPY closed the weekly candlestick in the red with 1.3% loss. Meanwhile, GBP/JPY closed with a bearish Doji pattern.
Last week, the Relative Strength Index (RSI) dipped below 50 on both pairs reflecting the end of uptrend momentum and a possible start of a downtrend move.
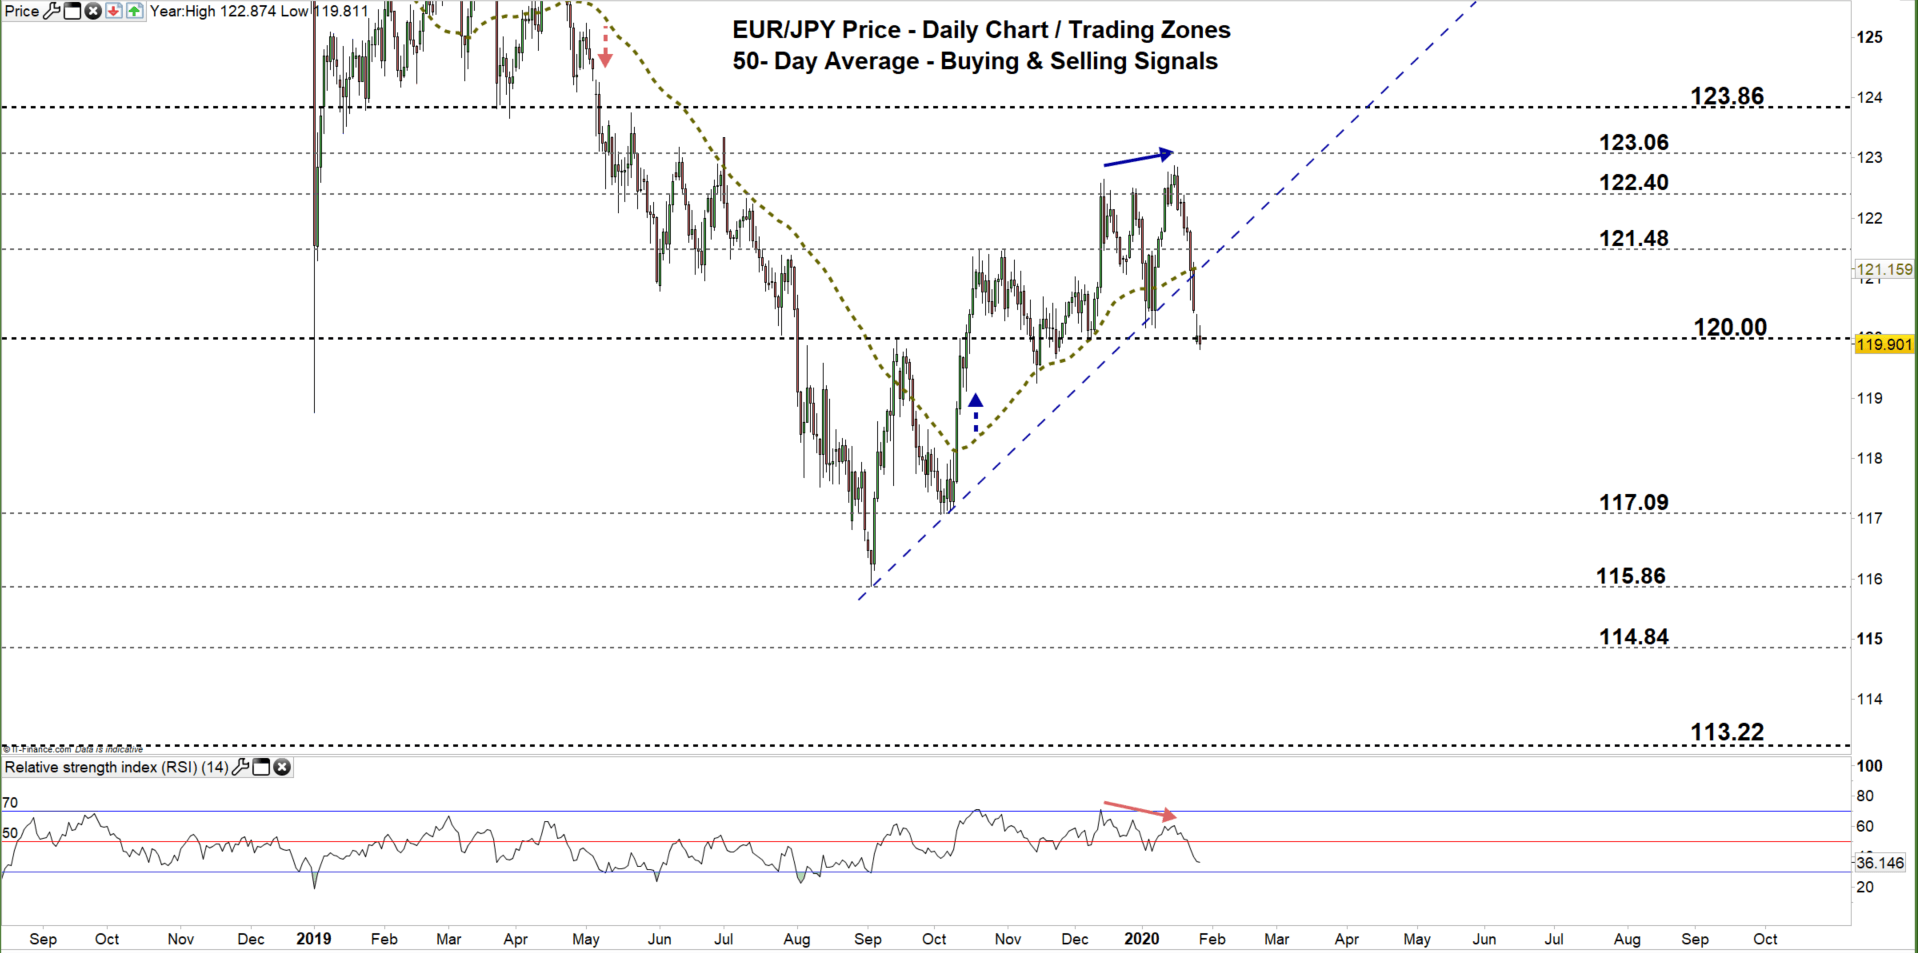
EUR/JPY Daily PRice CHART (AUG 25, 2018 – JAn 28, 2020) Zoomed Out

EUR/JPY Daily Price CHART (AUg 25 – JAn 28, 2020) Zoomed in
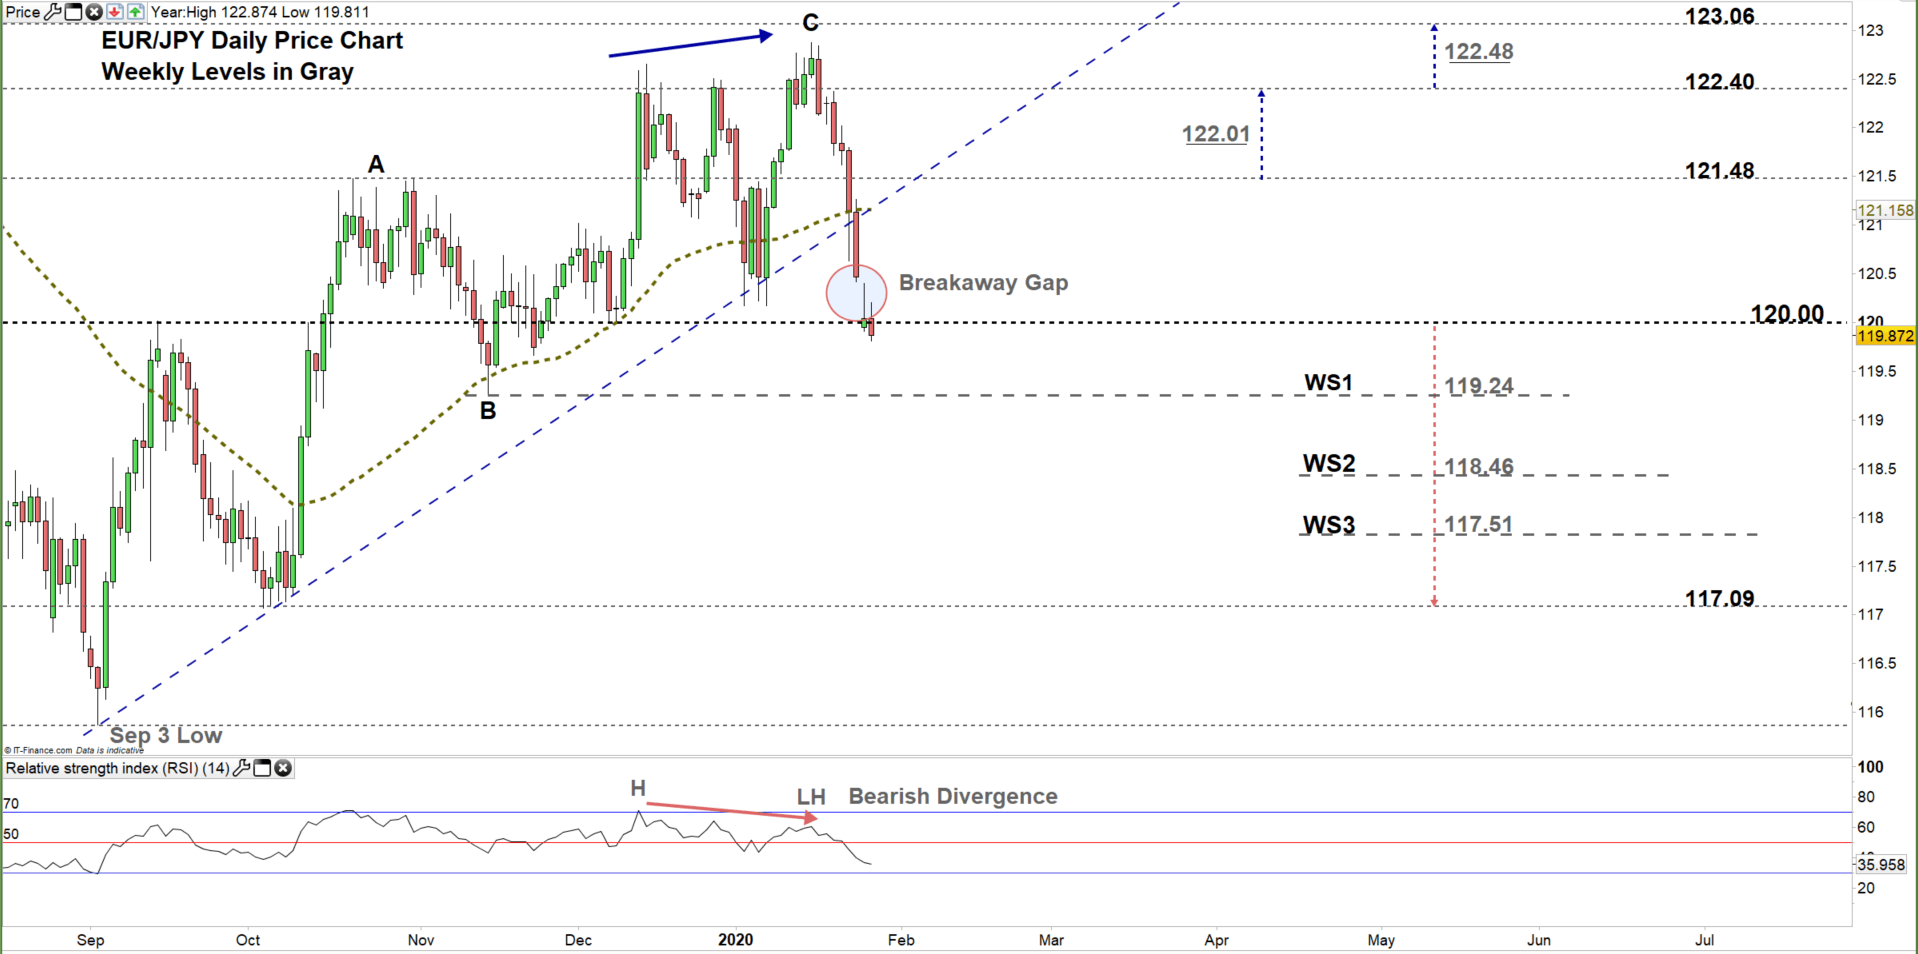
Looking at the daily chart, we notice on Jan 23 EUR/JPY reversed direction and tumbled to a lower trading zone 120.00 – 121.48 as indicated in our latest update. On Friday, the price broke below the uptrend line originated from the Sep 3 low at 115.86 then closed below the 50-Day average producing two bearish signals. This week, the market opened with a breakaway gap providing another bearish signal.
A close below the low end of the zone may convince EUR/JPY bears to press towards 117.09. Yet, the weekly support levels printed on the chart (zoomed in) should be considered as some traders might exit/join the market around these points.
In turn, any failure in closing below the low end of the zone, could lead to a sideways move i.e. reverse the market’s direction towards the high end of the zone. Further close above this level, may send EUR/JPY towards 122.40. Although, the weekly resistance level underlined on the chart would be worth monitoring.

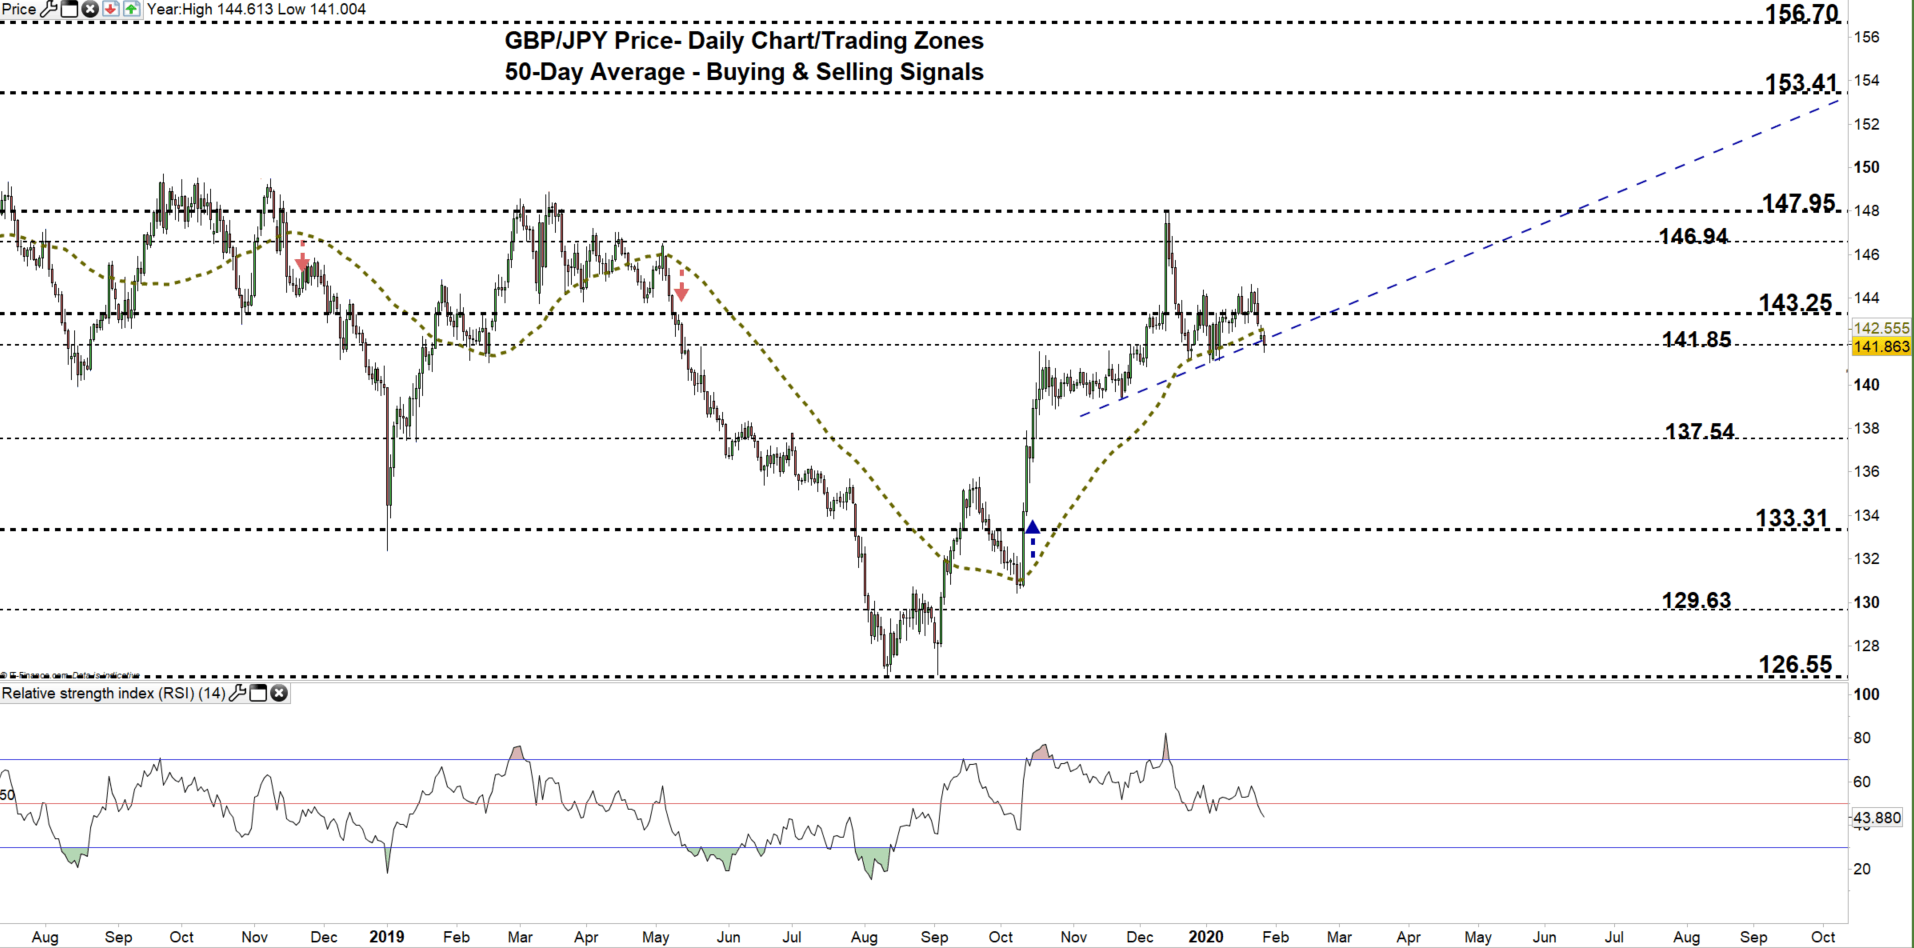
GBP/JPY Daily PRice CHART (Aug 20, 2018 – JAn 28, 2020) Zoomed Out
GBP/JPY Daily PRice CHART (Sep 15 – JAn 28, 2020) Zoomed In
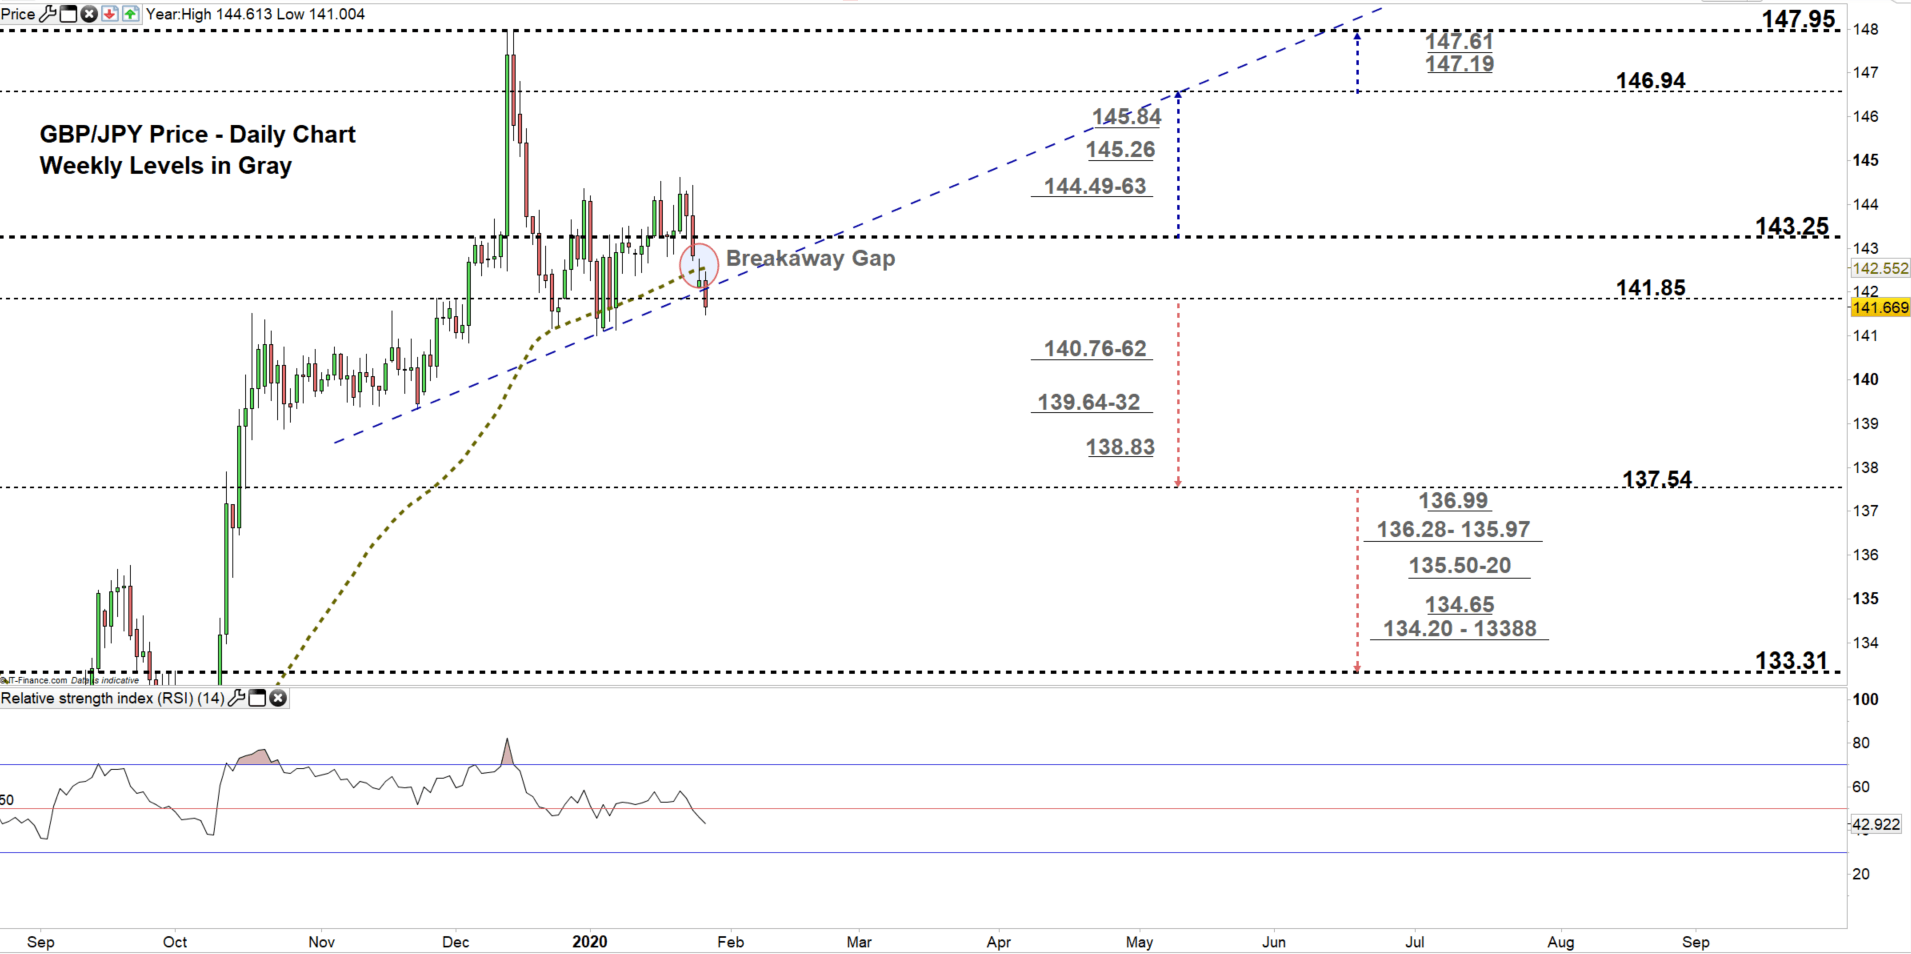
From the daily chart, we noticed that on Friday GBP/JPY plunged to a lower trading zone 143.25 – 141.85. This week, the market opened with a breakaway gap to the downside, then closed below the 50-Day average generating two bearish signals.
A close below the low end of the zone could embolden GBP/JPY bears to press towards 137.54. Further close below this level may cause more bearishness towards 133.31. That said, the weekly support levels and areas marked on the chart (zoomed in) should be kept in focus.
On the flipside, any close above the low end of the zone could mean a direction’s reversal towards the high end of the zone. Further close above this level might pave the way for GBP/JPY bulls to push towards 146.94. Nevertheless, the weekly resistance area and levels underscored on the chart should be watched closely.
Written By: Mahmoud Alkudsi
Please feel free to contact me on Twitter: @Malkudsi


