


EUR /JPY and GBP/JPY Technical Outlook
- Euro and British pound against Japanese Yen analysis
- EUR/JPY and GBP/JPY thresholds and signals to consider
GBP/JPY, EURJPY – Bulls Pullback
Last week, EUR/JPY rallied to 122.87-its highest level in five and half months. However, the market retreated from that level after some longs seemed to cut back. On the other hand, GBP/JPY rallied to 144.53 – its highest level in over five weeks. The price fell after and settled below 144.00 handle.
The Relative Strength Index (RSI) on both pairs remained flat above 50 indicating a weaker uptrend move.
EUR/JPY Daily PRice CHART (Jun 25, 2018 – JAn 22, 2020) Zoomed Out
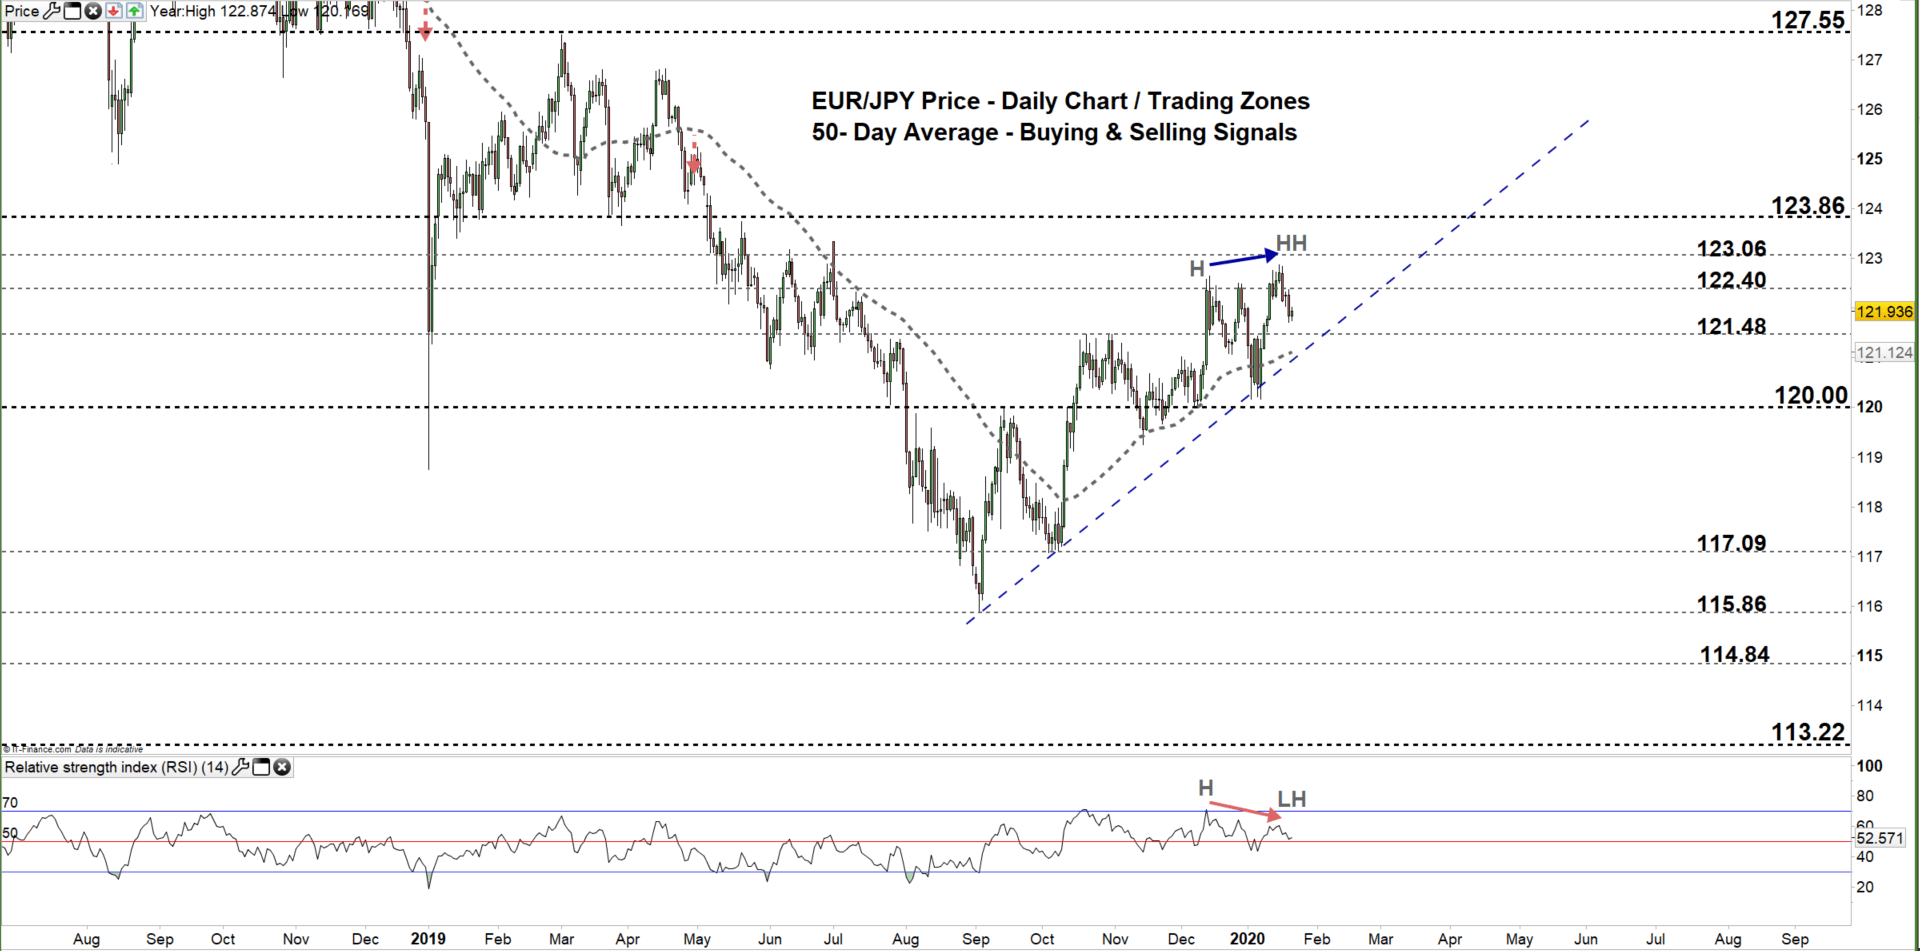
EUR/JPY Daily Price CHART (Sep 25 – JAn 22, 2020) Zoomed in

Looking at the daily chart, we noticed on Friday EUR/JPY tumbled to a lower trading zone 121.48 -122.40 eyeing a test of the low end of it. Additionally, we spotted a bearish divergence as the price created a high with a higher high meanwhile the RSI created a high with a lower high. This signals a possible reversal of uptrend move.
A close below the low end of the zone could embolden EUR/JPY bears to press the pair towards 120.00 handle. However, the weekly support levels underlined on the chart should be kept in focus as some traders may join/exit around these points.
Any failure in closing below the low end of the zone could inspire EUR/JPY bull’s comeback and reverse the market’s course towards the high end. Further close above the high end may increase the likelihood for more Bulls to join and rally the pair towards 123.06. Nevertheless, the weekly resistance level and area should be watched closely.

GBP/JPY Daily PRice CHART (Aug 20, 2018 – JAn 22, 2020) Zoomed Out

GBP/JPY Daily PRice CHART (April 25 – JAn 22, 2020) Zoomed In
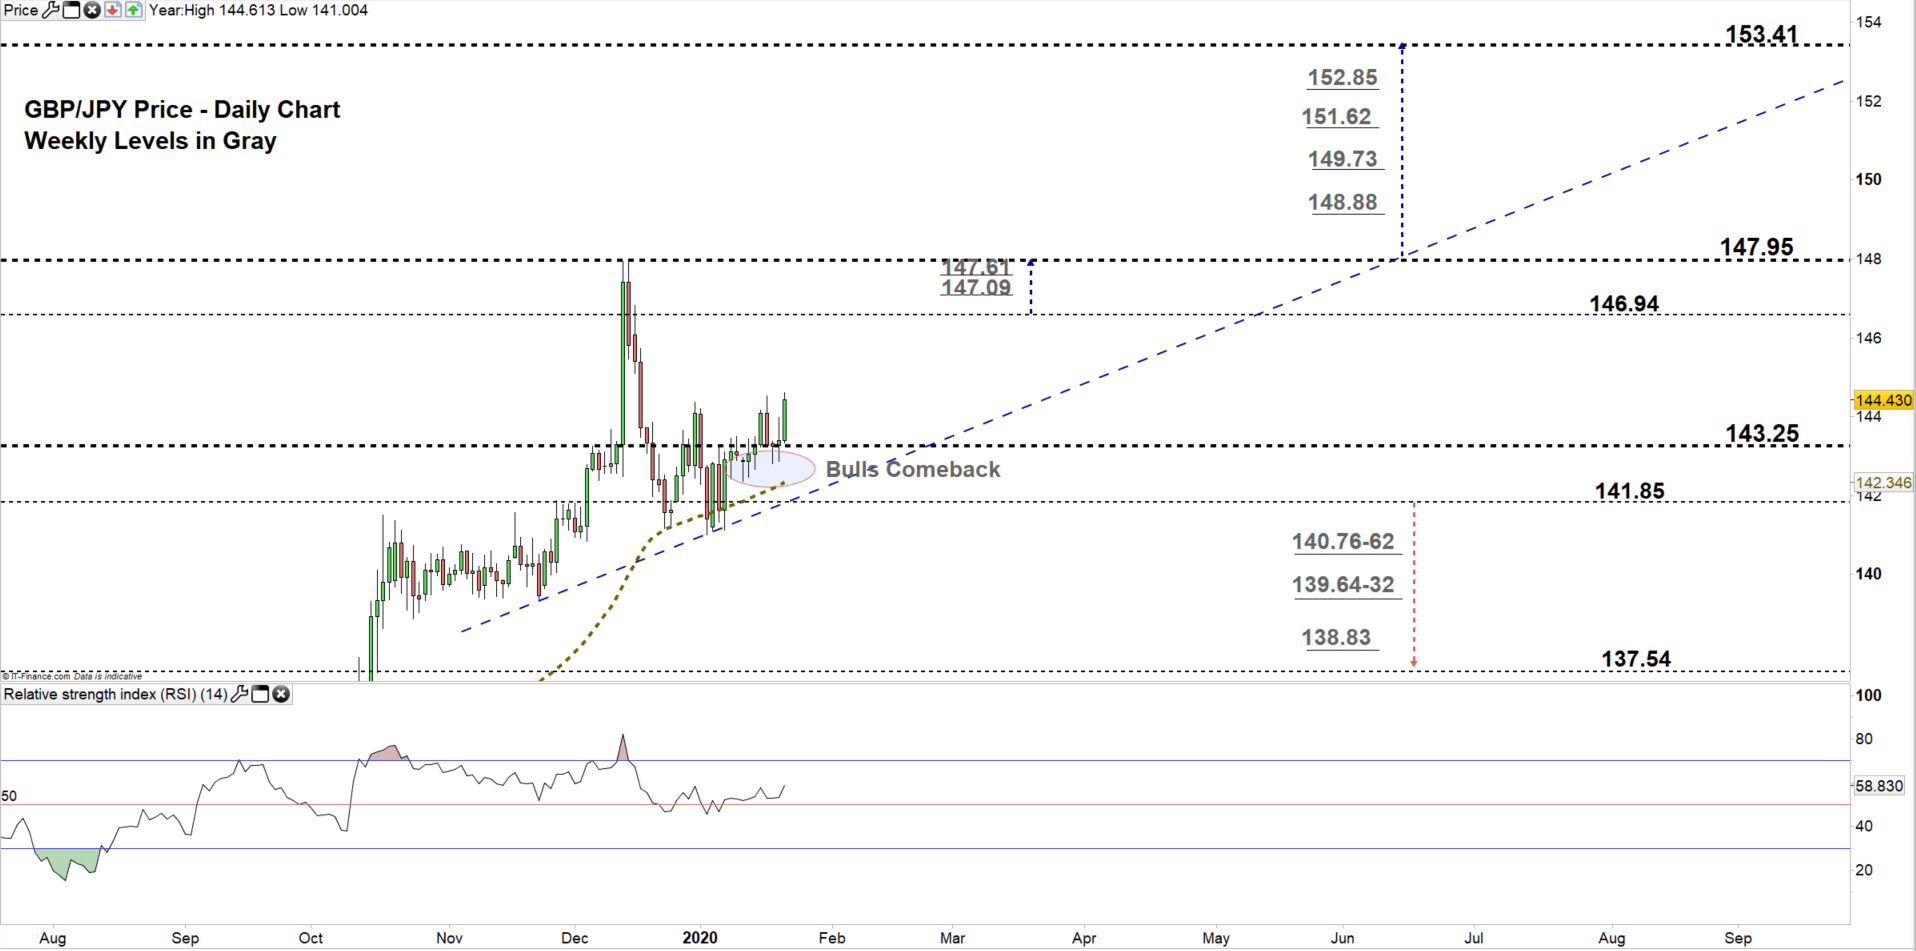
From the daily chart, we noticed that on Jan 8 GBP/JPY closed above 50-day average producing a bullish signal. Last week, bulls rallied the market then some seemed to cut back.Yesterday, they pushed the price to a higher trading zone 143.25 – 146.94.
A close above the high end of the zone could entice more bulls to join the move and push towards 147.95. Yet, the weekly resistance levels underlined on the chart would be worth monitoring.
In turn, any close below the low end of the zone reflects long’s hesitation. This could reverse the market’s direction towards 141.85. Further close below this level opens the door for GBPJPY bears to press towards 137.54. That said, the weekly support areas and level underlined on the chart should be considered.

Written By: Mahmoud Alkudsi
Please feel free to contact me on Twitter: @Malkudsi


