


GBP/JPY Price Forecast
See our free trading guide to help build confidence when you trade on JPY, USD and other main currencies Download for free our latest Q3 trading guides
GBP/JPY – The Sellers indecision
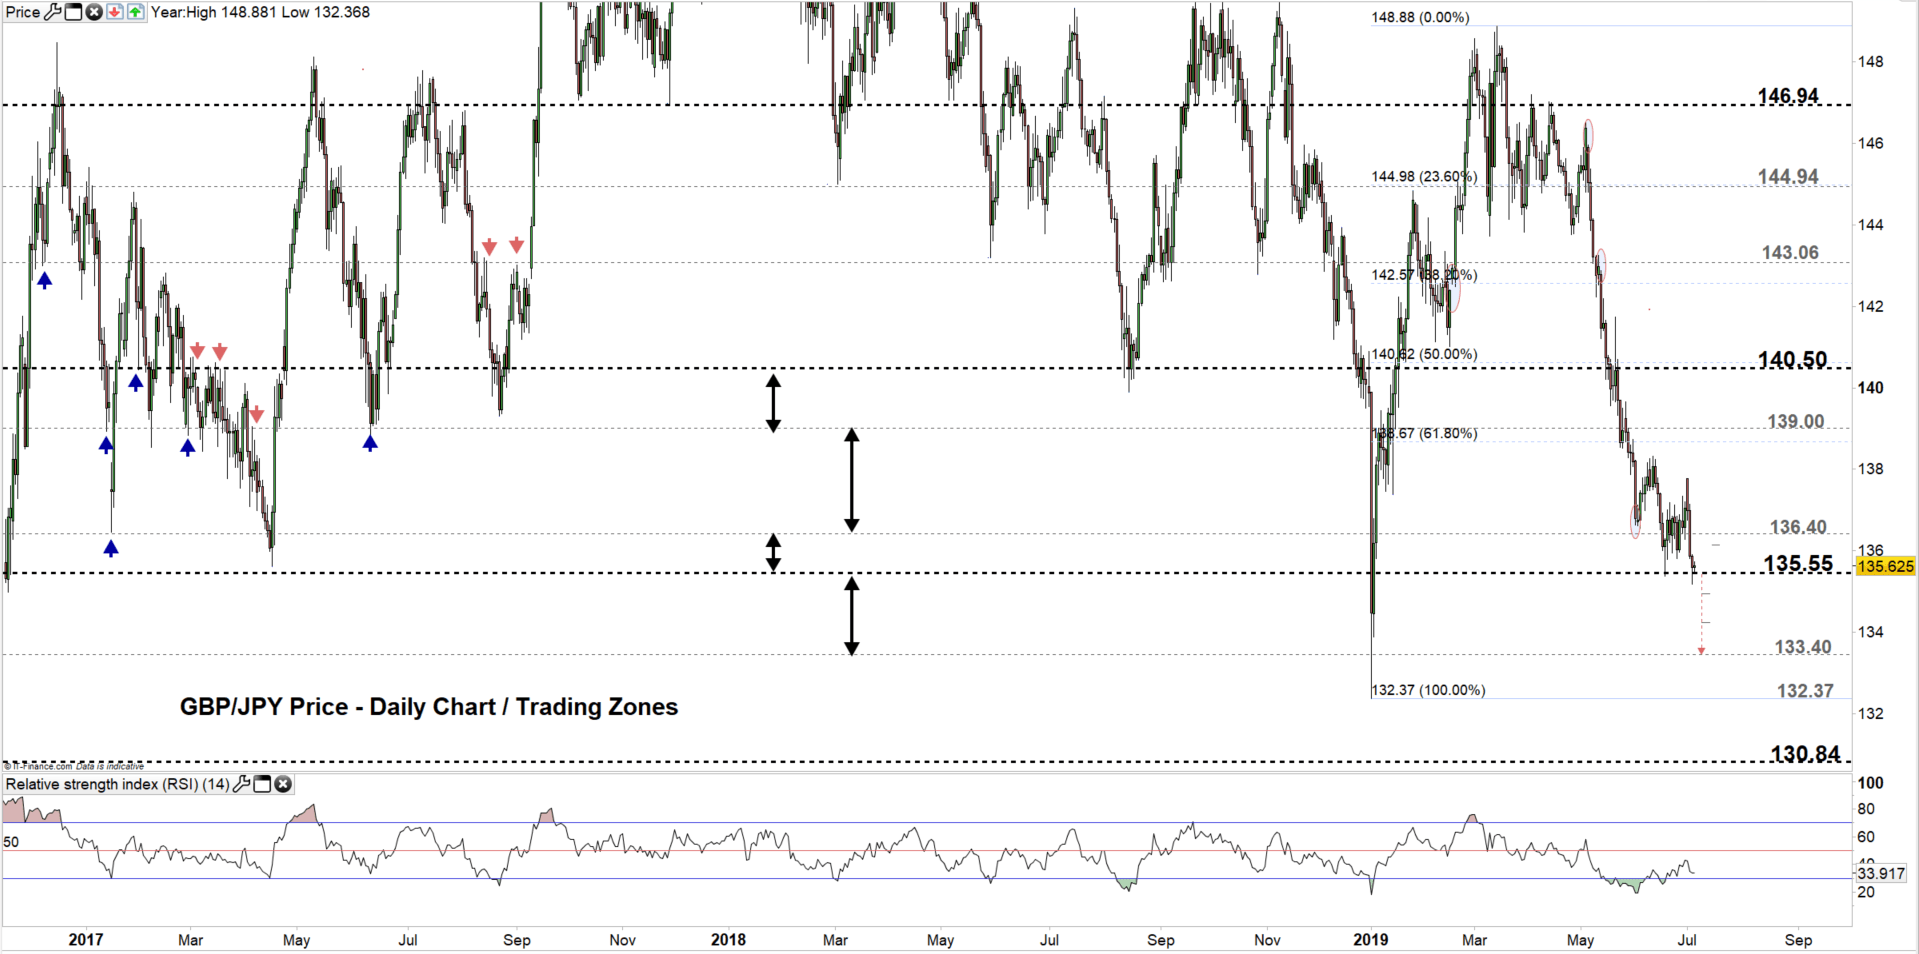
On June 25, GBP/JPY corrected higher and created a higher low 135.81. Yesterday, the pair printed 135.17- its lowest level in six months, however; closed with a Doji pattern reflecting the seller’s indecision to keep pressing the price lower.
At the start of this week the Relative Strength Index (RSI) fell from 43 to 34 then remained flat highlighting an exhausted bearish momentum and possibly more of a sideways movement.
Just getting started? See our Beginners’ Guide for FX traders
GBP/JPY DAILY PRICE CHART (Oct 13, 2016 – JULY 4, 2019) Zoomed out
GBP/JPY DAILY PRICE CHART (MAR 24, – JULY 4, 2019) Zoomed IN

Looking at the daily chart we notice on Tuesday GBP/JPY entered the lower trading zone 135.55 – 136.40, however; it failed yesterday to close below the low end of the zone. Hence; if the sellers repeat their attempt then a close below the lower end could press the price lower towards 133.40, although; the weekly support levels marked on the chart (zoomed in) should be kept in focus.
In turn, we notice GBP/JPY is eying today the high end of the trading zone after closing yesterday above the lower end. Additionally, a close above this level may cause the price to rally towards 139.00, however; the weekly resistance levels underlined on the chart would be worth monitoring.
Having trouble with your trading strategy? Here’s the #1 Mistake That Traders Make
GBP/JPY Four-HOUR PRICE CHART (JunE 18 – July 4, 2019)

Looking at the four-hour chart, we notice yesterday GBP/JPY broke below the low end of the trading range 135.78 – 137.17 then rebounded from 135.17, therefore; a break below this threshold may send the price even lower towards 134.38 contingent on clearing the weekly support underlined on the chart.
On the other hand, we notice the pair is eyeing today a return to the aforementioned trading range, hence; a break above 1340.40 may cause the price to rally to the high end of this range, nonetheless; the daily resistance levels highlighted on the chart need to be watched along the way. See the chart for more details if the rally continued above mentioned levels.
Written By: Mahmoud Alkudsi
Please feel free to contact me on Twitter: @Malkudsi


