


GBP/JPY Price Forecast, Charts and Analysis
- GBP Sterling looking ahead to CPI numbers today and Bank of England interest rate decision tomorrow.
- GBP/JPY at its lowest levels since the start of the year.
See our guides to learn about forces leading Sterling and Japanese Yen prices. Download free our Q2 main currencies forecasts
GBP/JPY – Trading Lower
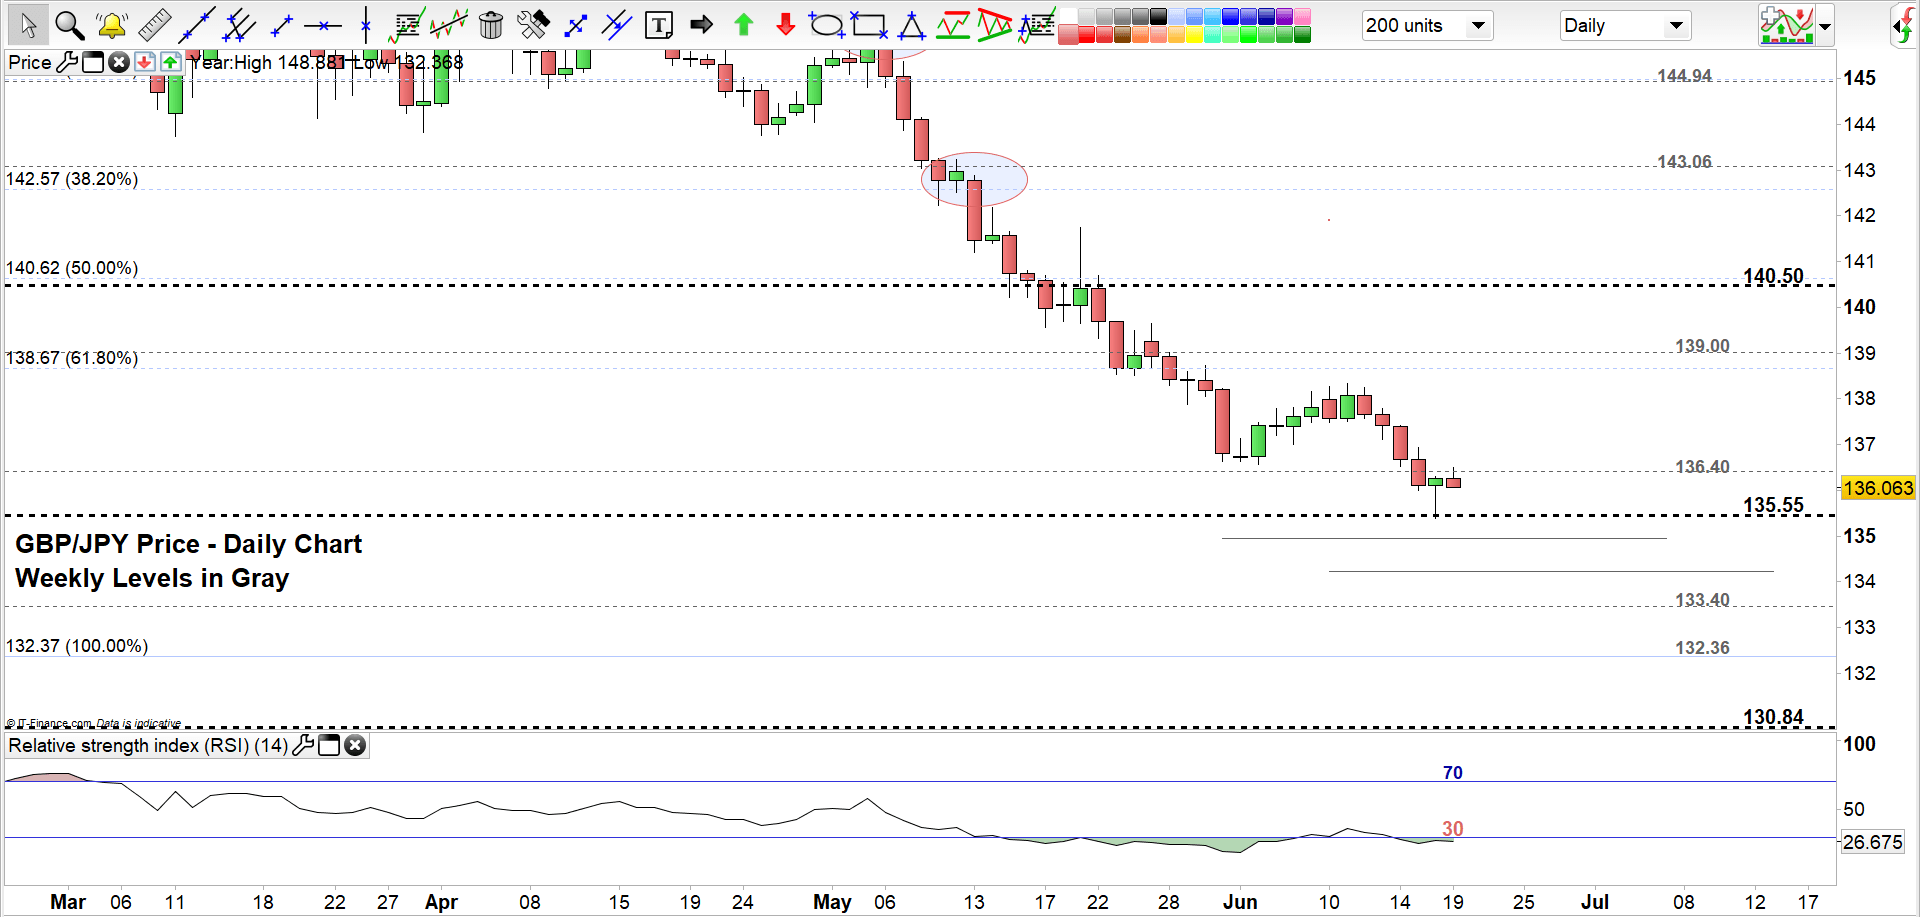
On June 17, the sellers pressed GBP/JPY below the level discussed in our last update 136.40 leading the price in the following day to print its lowest level in five and a half months at 135.38.
The Relative Strength Index (RSI) has remained since Friday in the oversold territory (below 30) highlighting the strength of the bearish momentum.
Just getting started? See our Beginners’ Guide for FX traders
GBP/JPY DAILY PRICE CHART (Feb 7, 2019 – JUnE 19, 2019) Zoomed In
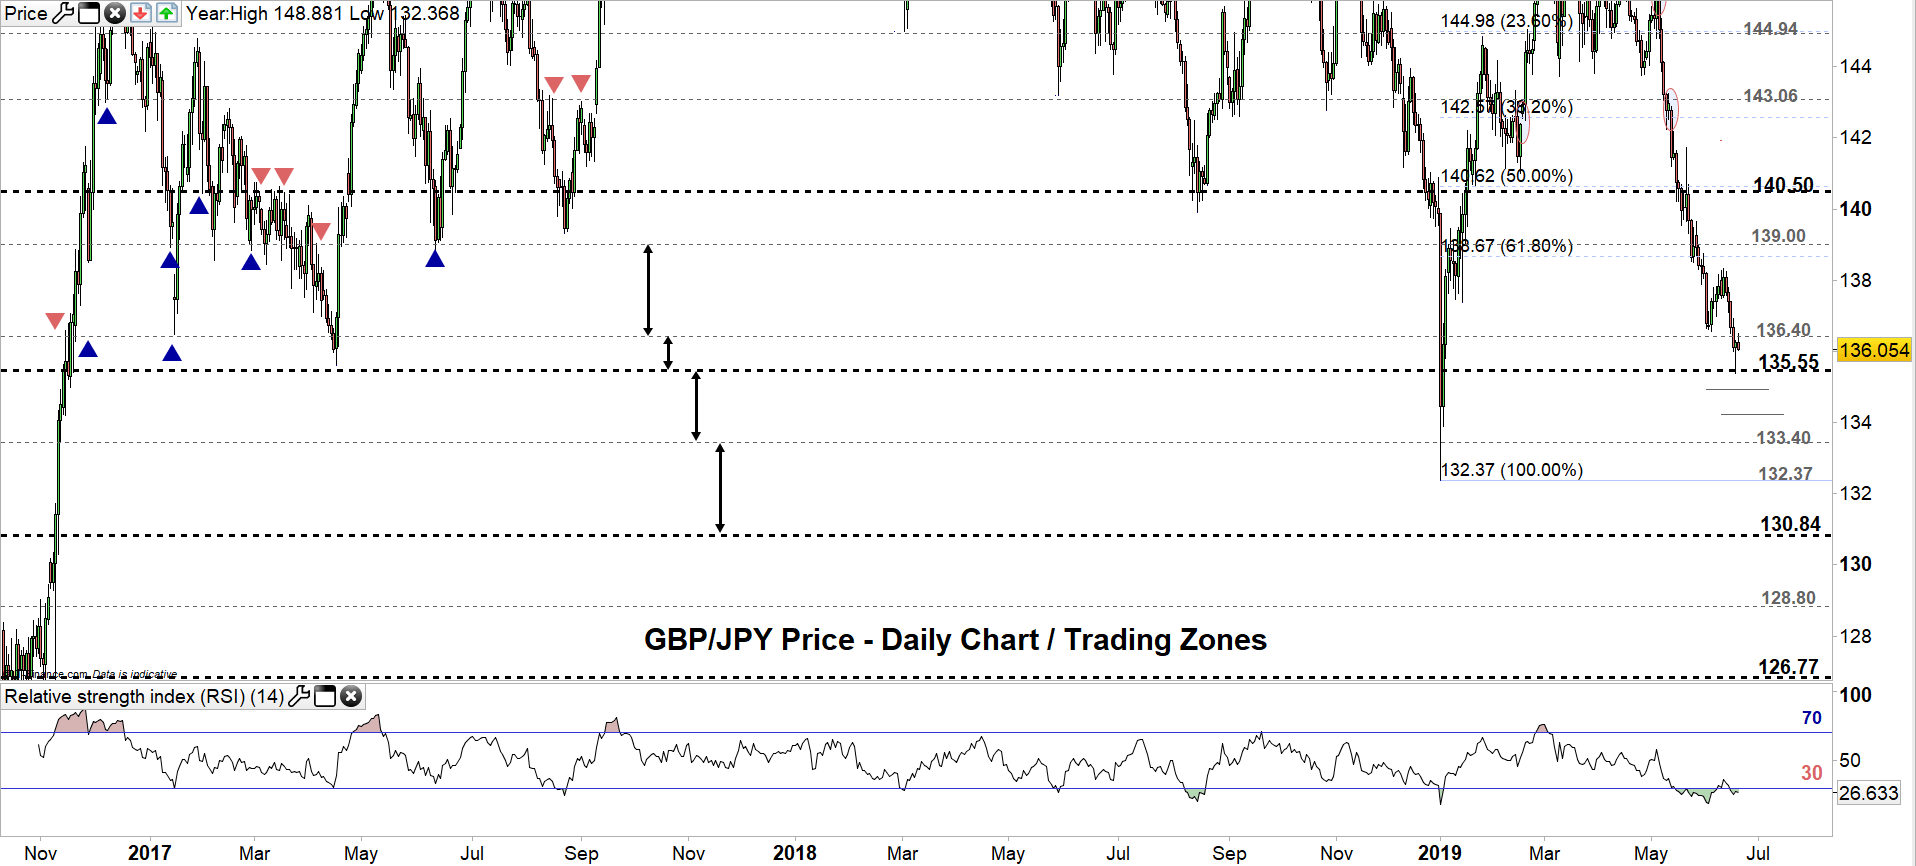
GBP/JPY DAILY PRICE CHART (Oct 13, 2016 – JUnE 19, 2019) Zoomed OUT
Looking at the daily chart we notice GBP/JPY may be looking to continue its bearish move. Therefore, a close below 135.55 could likely lead the price to the low end of the trading zone 133.40 –135.55. Although, the weekly support levels at 134.94 and 134.20 need to be kept in focus.
A failure to close below 135.55 may rally the price to test again 136.40. If the price closes above this level it could rally towards 139.00 however, the daily resistances at 137.48 and the vicinity at 138.36-46 need to be watched along the way.
Having trouble with your trading strategy? Here’s the #1 Mistake That Traders Make
GBP/JPY Four-HOUR PRICE CHART (, 2019- JUN 19, 2019)
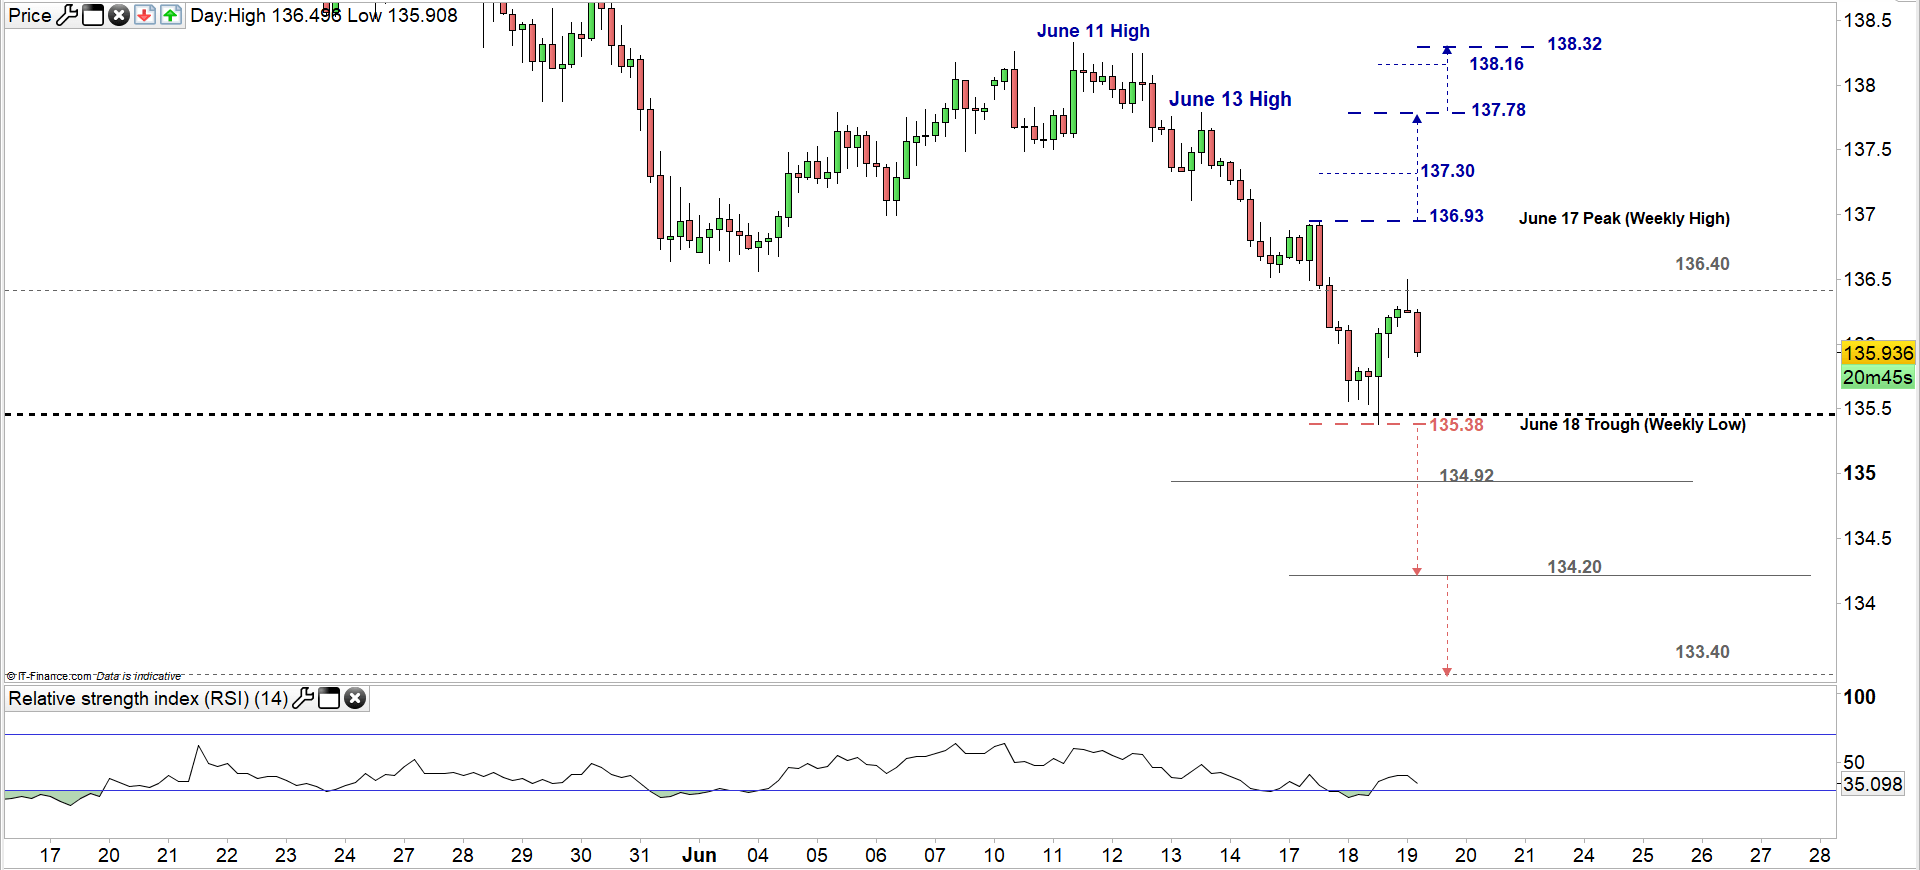
Looking at the four-hour chart, we notice on June 11 GBP/JPY rebounded from 138.32 and started a downtrend creating lower highs and lower lows. Today, the pair tested trading above 136.40 however, the first candlestick closed with a bearish Doji pattern showing a possible intention from the sellers to resume pressing the price lower.
Therefore, any break below the June 18 low at 138.58 may lead the price towards 134.20. However, the first weekly support mentioned above should be watched closely.
On the flipside, a rally above the June 17 peak at 136.93 could see the price trading even higher towards the June 13 peak at 137.78. Although, the weekly resistance at 137.30 needs to be considered. See the chart for more key levels if the rally continues above 137.78.
Written By: Mahmoud Alkudsi
Please feel free to contact me on Twitter: @Malkudsi


