


GBP/JPY Price Outlook, Charts and Analysis
- GBP Sterling looking ahead to weekly earning numbers due to release tomorrow.
- GBP/JPY looking to correct higher.
Did we get it right with our GBP and JPY forecasts? Find out more for free from our Q2 GBP and JPY and main currencies forecasts
To learn more about data releases for this week check out DailyFX Economic Calendar
GBP/JPY – Bears Holding Fire
On June 4 bearish momentum started to fade as support level held. Since then GBP/JPY rallied and tested on Jun 7 the high end of the trading range (136.40 – 137.84), however it failed to close above.
Alongside, the Relative Strength Index (RSI) on Jun 6 abandoned the oversold territory and pushed above 30 reflecting the weakness in the bearish momentum.
Having trouble with your trading strategy? Here’s the #1 Mistake That Traders Make
GBP/JPY DAILY PRICE CHART (FEB 24, 2019 – JUnE 10, 2019) Zoomed In

GBP/JPY DAILY PRICE CHART (NOV 10, 2016 – JUnE 10, 2019) Zoomed OUT

Looking at the GBP/JPY daily chart we notice the pair opened today with a gap to the upside, sending the price to trade in a higher trading range (137.84 – 139.00). Therefore, a close above 137.84 suggests more bullishness towards 139.00. A further bullish close above 139.00 could lead the price to rally towards 140.50. However, resistance levels at 139.55 and 140.06 need to be watched closely.
In turn, a close below 137.84 would return GBP/JPY to trade in the same old trading range with a likelihood to trade lower to 136.40. The weekly support levels at 137.55 and 136.99 would be worth monitoring.
Just getting started? See our Beginners’ Guide for FX traders
GBP/JPY Four-HOUR PRICE CHART (May 13, 2019- JUN 10, 2019)
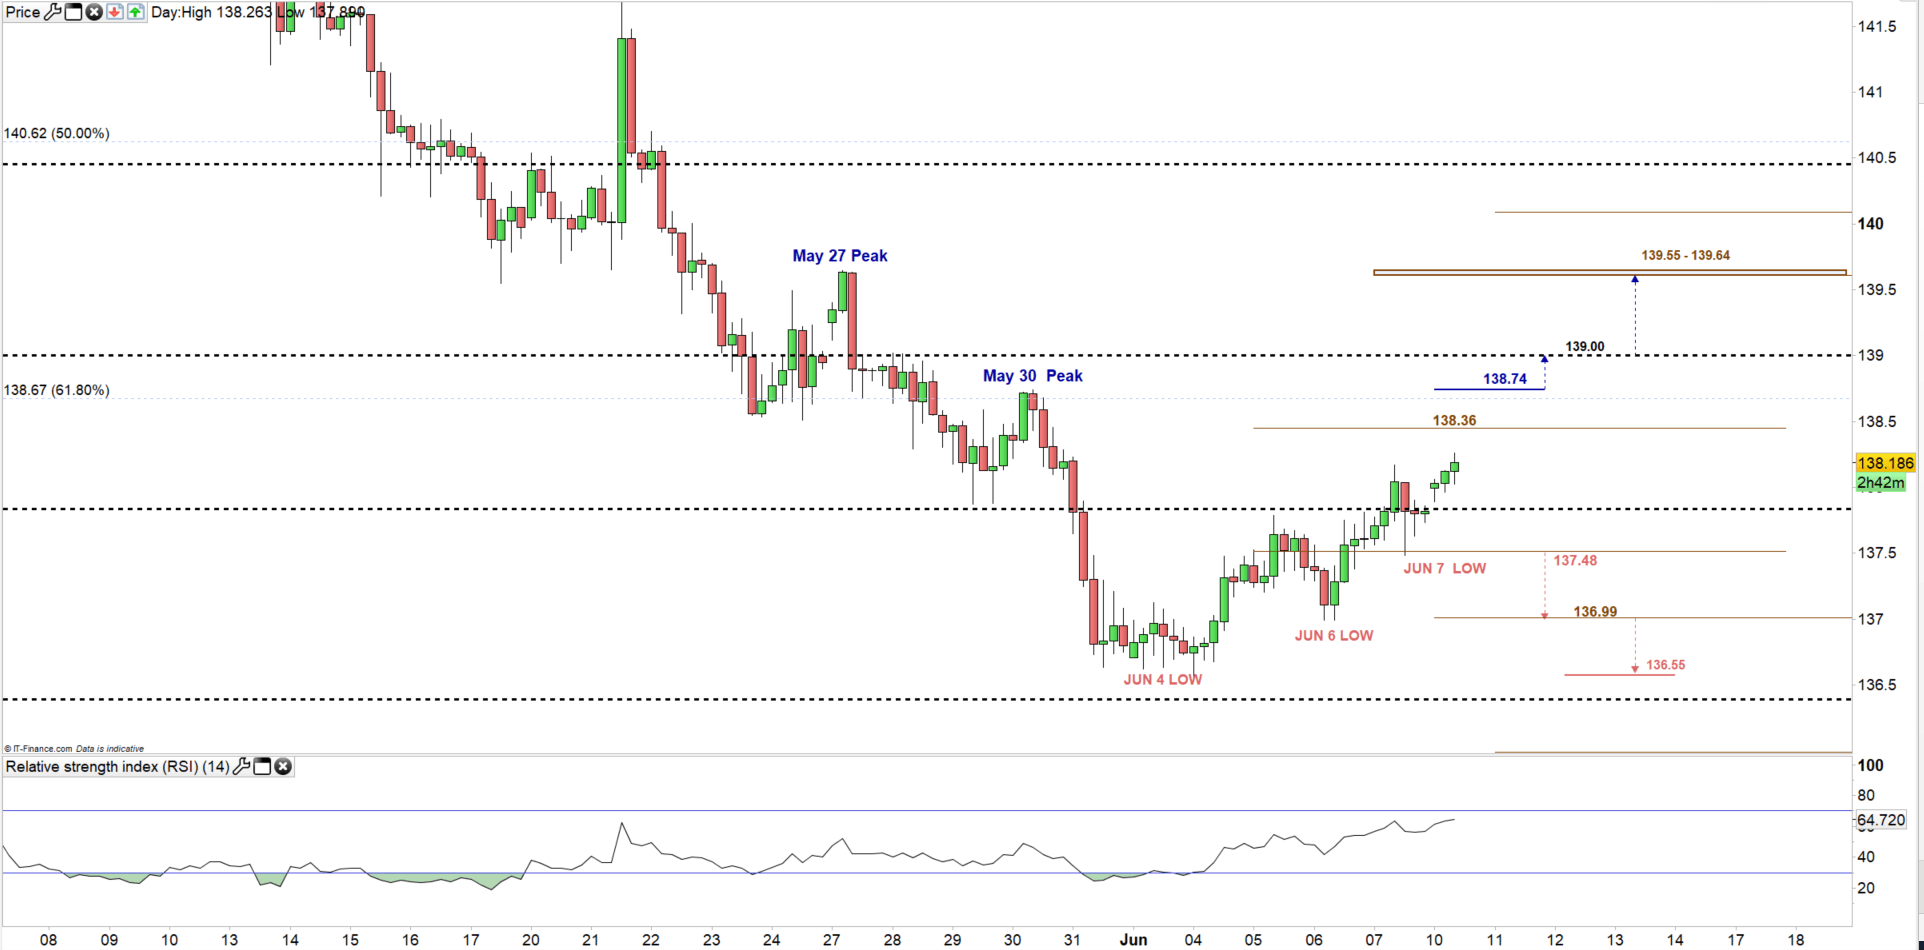
Looking at the four- hour chart, on last Friday GBP/JPY pointed lower and created a low at 137.48. Therefore, a break below this threshold could open the door for more bearishness towards the June 6 low at 136.99 and if the selloff continues the bears could push towards the June 4 low at 136.55.
On the flipside, if GBP/JPY breaks above the May 30 high at 138,74 this could send the price to trade higher eying the resistance zone at 139.55 – the May 27 high at 139,64. However, weekly resistance at 139.00 need to be in focus.
Written By: Mahmoud Alkudsi
Please feel free to contact me on Twitter: @Malkudsi


