


Talking Points
- GBP/JPY continues to fall within the downward channel it has traded in for most of 2017.
- There’s little sign of that changing in the foreseeable future.
- See the DailyFX Economic Calendar and see what live coverage for key event risk impacting FX markets is scheduled for the week on the DailyFX Webinar Calendar.
Further losses are likely near-term in GBP/JPY as it continues to fall within the well-defined downward channel that has been in place for most of this year. As the Japanese Yen continues to be one of the havens of choice for investors concerned about Syria, North Korea and the French elections, the British Pound is one of many currencies to weaken against it.
Chart 1: GBP/JPY Daily Timeframe (December 2016 to April 2017)
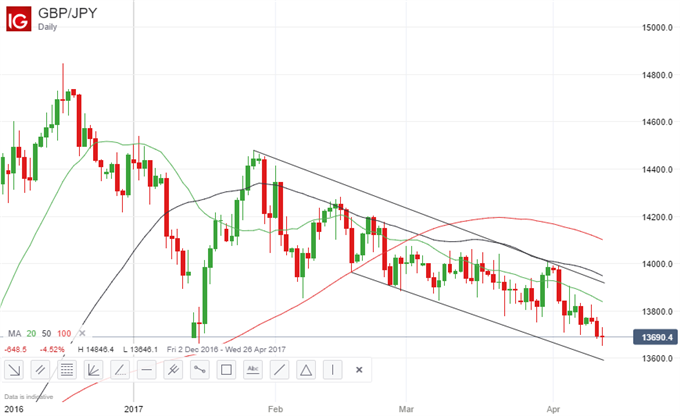
As the chart above shows, GBP/JPY would need to fall to around 136 to signal a sharper decline, while only a rise above 139 would imply a breakout to the upside. Even then, the 50-day and 100-day moving averages would provide resistance that would have to be overcome before the advance could accelerate.
Turning to the five-minute chart, a rise in GBP/JPY in late Asian/early European trading Wednesday soon ran out of steam and the cross then eased before rallying again.
Chart 2: GBP/JPY 5-minute Timeframe (April 12, 2017)

The near-term outlook therefore remains bearish, with short positions in the cross favored. The key targets on the downside are the 136.51 low touched on January 16 and then the lower boundary of the channel on the daily chart, currently at 135.84. On the upside, the key resistance levels are the upper boundary of the channel, now at 139.10, the 50-day moving average at 139.55 and the 100-SMA at 141.02.
However, more cautious day traders favoring the downside might be wise to place a stop before then, at 138.30, where the 20-SMA currently sits.
--- Written by Martin Essex, Analyst and Editor
To contact Martin, email him at martin.essex@ig.com
Follow Martin on Twitter @MartinSEssex
If you’re looking for longer-term trading ideas, check out our Trading Guides; they’re free and updated for the first quarter of 2017
If you’re looking for ideas more short-term in nature, please check out our Speculative Sentiment Index indicator (SSI)


