


To receive Ilya's analysis directly via email, please SIGN UP HERE
Talking Points:
- GBP/JPY Technical Strategy: Flat
- Support: 177.28, 175.77, 173.85
- Resistance: 178.39, 180.18, 181.64
The British Pound continues to consolidate against the Japanese Yen but the outlines of a Triangle chart pattern hint at on-coming downside resumption. Near-term support is at 177.28, the 14.6% Fibonacci retracement, with a break below that on a daily closing basis exposing Triangle support at 175.77. Alternatively, a push above 178.39, the intersection of Triangle top resistance and the 23.6% level, opens the door for a test of the 38.2% Fib at 180.18.
Positioning is inconclusive at this point, with prices offering no clear-cut and actionable signal to initiate a long or short trade. We will continue to remain on the sidelines for the time being, waiting for a compelling opportunity to present itself.
Add these technical levels directly to your charts with our Support/Resistance Wizard app!
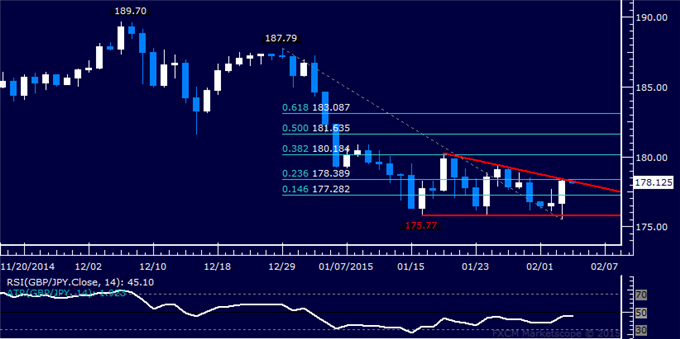
Daily Chart - Created Using FXCM Marketscope
--- Written by Ilya Spivak, Currency Strategist for DailyFX.com


