


Talking Points:
- CAC 40 Consolidates with an Inside Bar
- An Inside Bar May Help Traders Identify Future Breakouts
- Looking for additional trade ideas for equities markets? Read our 2017 Market Forecast
CAC 40 has failed to make little progress this week, and has failed to make any significant progress for today’s session. So far for Thursday’s trading, the Index is trading up slightly (+0.15%). Top winners for the CAC 40 include Bouygues (+4.55%) and Airbus (+3.91%). Losers for the day include Veolia Environment (-6.59%) and Peugeot (-1.76%).
Technically, the CAC 40 may be considered as trading in a short term uptrend. Despite the consolidation of the last two sessions, the Index remains above its 10 Day EMA (exponential moving average) found at 4,885.09 However with today’s lack of volatility, the Index may close with the formation of an inside bar. That means traders may reference Wednesday's daily candle to identify future market breakouts. Bullish breakouts may be considered above Wednesday’s high of 4,923.10. Alternatively, bearish breakouts may be considered beneath Wednesday’s low of 4,865.80.
CAC 40, Daily Chart with Range
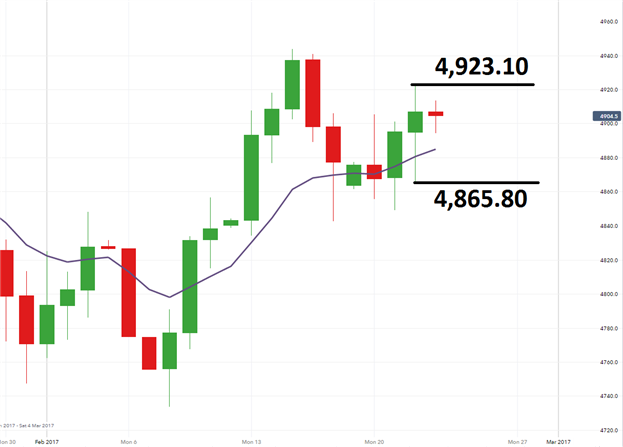
(Created Using IG Charts)
Intraday the CAC 40 is now bouncing above today’s central pivot found at 4,898.60. If prices continue to rally above this value, this opens the Index up to test further values of resistance. This first includes the R1 pivot found at 4,931.40, and then the R2 pivot at 4,955.90.
If prices are rejected near present values, bearish momentum may begin as the CAC 40 trades back below the previously mentioned central pivot. Key values of intraday support include the S1 and S2 pivots found at 4,874.10 and 4,841.30 respectively.
CAC 40, 30 Minute Chart with Pivots

(Created Using IG Charts)
--- Written by Walker, Analyst for DailyFX.com
To Receive Walkers’ analysis directly via email, please SIGN UP HERE
See Walker’s most recent articles at his Bio Page.
Contact and Follow Walker on Twitter @WEnglandFX.


