


Talking Points
- CAC 40 Fails at the 200 Day SMA
- Current Daily Support is Found Near 4,302.50
- If you are looking for more trading ideas for equities markets, check out our Trading Guides
The CAC 40 is declining for the third consecutive trading session, after being rejected Friday from its 200 Day SMA (Simple Moving Average) at 4,454.00. For the session, the CAC 40 is trading down -1.51%. Of the 40 listed components, BNP has had the biggest daily decline trading down -4.20%. The next daily swing low for the CAC 40 may be found near 4,302.50. If prices rally above this value, the CAC 40 may rebound to retest the previously mentioned SMA. Alternatively, a daily break below this point may open up the Index for a larger decline.
CAC 40, Daily Chart

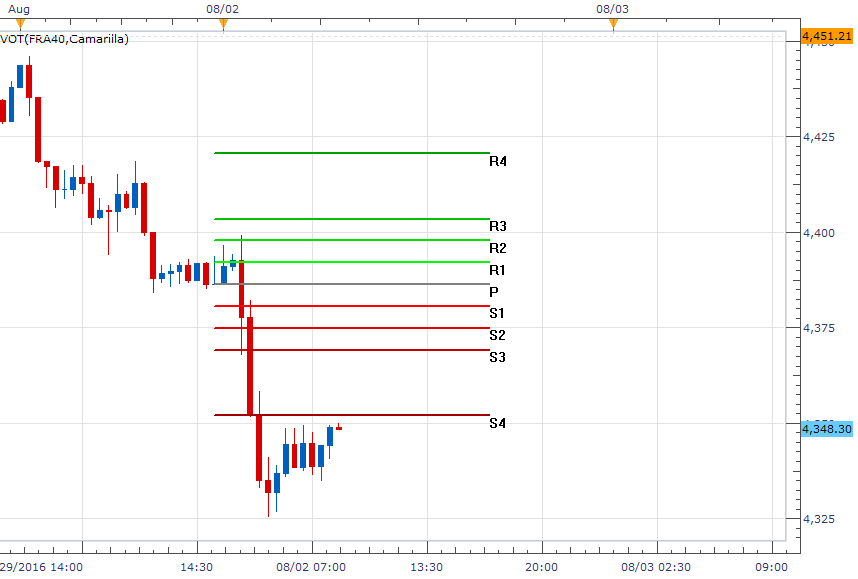
Short-term technical levels for the CAC 40 include over the S4 Camarilla pivot, at 4,352.04. Price has currently retraced to this value, and as long as price remains below it, the CAC 40 may maintain its bearish momentum. If price trades back above 4,352.04, it opens the Index to move back inside of today’s trading range. The pivot range for today’s session begins at 4.369.17 and concludes at the R3 pivot at 4,403.43. A move back inside of this range would be significant, as it would suggest a change in momentum for the Index. A continued bullish move may also expose the R4 pivot, which is currently located at a price of 4,420.57.
CAC 40, 30 Minute Chart
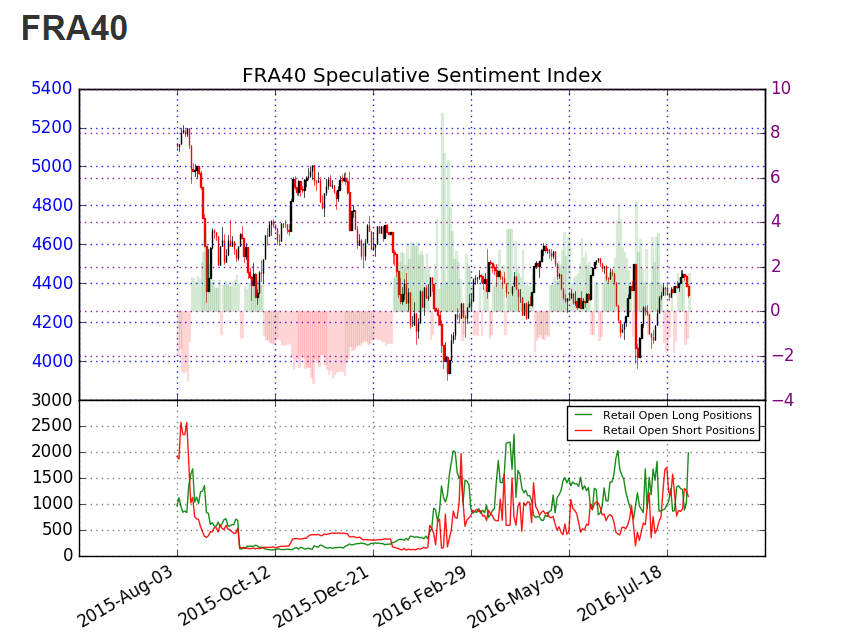
Find out real time sentiment data with the DailyFX’s sentiment page.
Traders tracking sentiment should note that SSI for the CAC 40 (Ticker: FRA40) reads at -1.34. With 57% of positioning short, this creates a bias towards further advances in price. In the event that prices breakout higher, SSI figures should move towards a negative extreme of -2.0 or more. Alternatively, in the event of a bearish reversal traders should look for SSI to move towards values that are more neutral.
To Receive Walkers’ analysis directly via email, please SIGN UP HERE
See Walker’s most recent articles at his Bio Page.
Contact and Follow Walker on Twitter @WEnglandFX.


