


Talking Points
- The CAC 40 Opens Up 0.23% Higher
- Today’s Daily Candle Marks 9 Days of Consolidation
- SSI Reads Bearish at +1.82
CAC 40 Daily Chart
(Created using Marketscope 2.0 Charts)
Interested in Learning the Traits of a Successful Trader? Click HERE
The CAC 40 is trading up .23% this morning, as the Index looks poised to consolidate for the ninth consecutive day. For the session, LafarageHocim is leading the Index trading up 2.41%. Conversely, Unibal has the biggest decline for Wednesday trading down -1.82%. Technical traders should note that the CAC 40 is still trading inside of the high (4,582.50) and low (4,302.00) established on March 10. As prices continue to consolidate, traders can take advantage of sideways price action by looking for range trading opportunities.
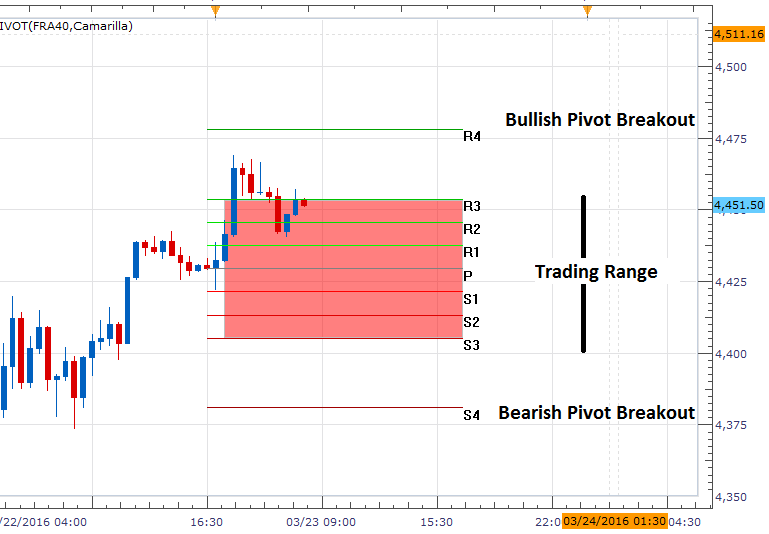
Currently, the CAC 40 is trading just below today’s R3 Camarilla Pivot, which is found at a price of 4,453.78. If price action remains range bound, the Index may be poised to return towards values of support, which includes the S3 pivot point displayed below. The S3 pivot is found at a price of 4,405.22, and marks today’s value of range support. Alternatively, in the event that prices breakout from the pivot range, traders should continue to monitor the R4 and S4 pivot points. Bullish breakouts may begin today above the R4 pivot at a price of 4,478.07. Bearish breakouts begin beneath S4 at a price of 4,380.93. In either breakout scenario, trend traders will look for prices to then challenge the daily values of support and resistance mentioned previously. A move through either of these values would symbolize an important change in market conditions, allowing traders to position themselves with the markets chosen direction.
CAC 40 30 Minute Chart with Camarilla Pivots

(Created using Marketscope 2.0 Charts)
SSI (speculative sentiment index) for the CAC 40 (Ticker: FRA40) is currently reading at +1.82. It should be noted here that this value has steadily increased from the last Thursdays reported total of +1.59. When taken as a contrarian signal, this increase in long positioning may suggest future declines in price for the CAC 40. Alternatively, traders watching for a bullish advance in price should continue to watch sentiment numbers to see if SSI levels off to a more neutral value.
To Receive Walkers’ analysis directly via email, please SIGN UP HERE
See Walker’s most recent articles at his Bio Page.
Do you know the biggest mistake traders make? More importantly, do you know how to overcome the biggest mistake? Read page 8 of the Traits of Successful Traders Guide to find out [free registration required].
Contact and Follow Walker on Twitter @WEnglandFX.


