


Euro vs US Dollar Technical Outlook
EUR/USD- Weaker Bullish Momentum
On June 10, EUR/USD rallied to a three-month high at 1.1422. However, the price retreated as some bulls seemed to cut back therefore, the weekly candlestick closed in the red with a 0.3% loss.
This week, bulls eased up further amid lingering concerns about a new spike in Covid-19 cases in the US and the reports about new cases in China could offset hopes of a V-shape economic recovery. Additionally, border tensions between North and South Korea, and between India and China weakened risk-on sentiment in the markets.
EUR/USD DAILY PRICE CHART (AUG 1, 2018 – June 19, 2020) Zoomed Out


EUR/USD DAILY PRICE CHART ( April 9– June 19, 2020) Zoomed IN
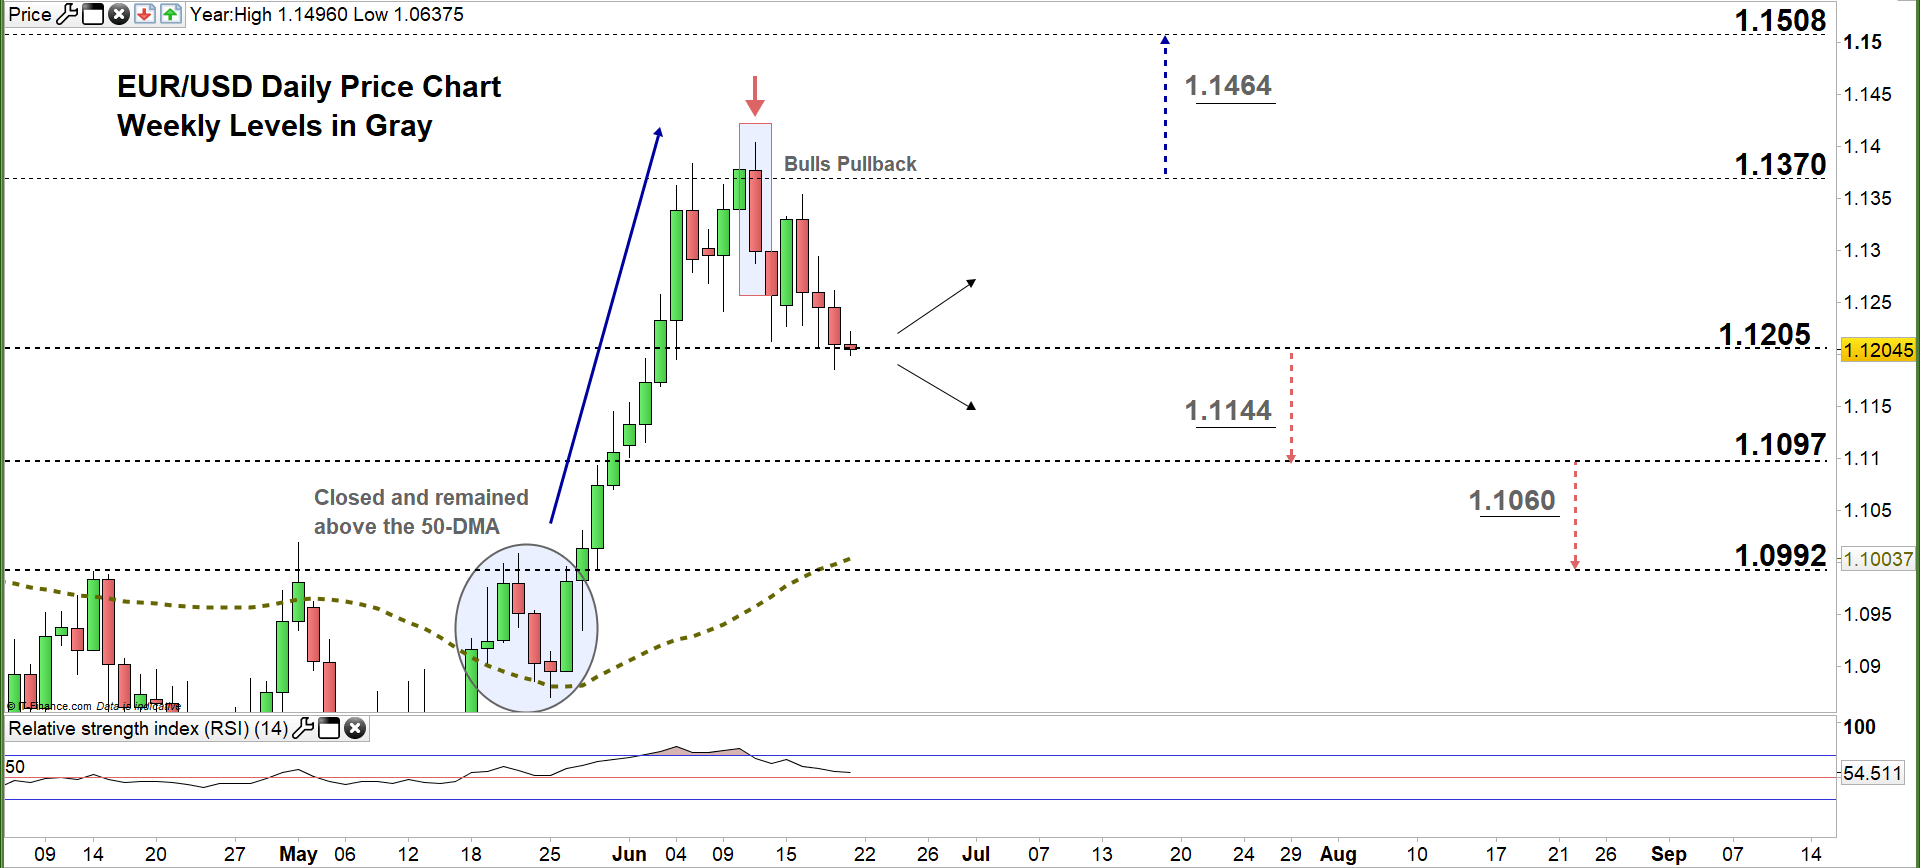
On June 11, EUR/USD declined to the current trading zone 1.1205 – 1.1370 signaling that bulls were losing momentum. Yesterday, the price tested the low end of the aforementioned zone yet closed above it, indicating that bulls were still in charge.
A close below the low end of the zone could end the bullish momentum and send EURUSD towards 1.1097. Any further close below this level may send the price even lower towards 1.0992.
On the flip-side, another close above the low end of the zone reflects that bullish bias is still intact and this may cause a rally towards the high end of the zone. Any further close above that level could extend the rally towards 1.1508.
See the daily chart (zoomed in) to know more about the key levels to monitor in both scenarios.

EUR/USD Four-Hour PRICE CHART (May 14 – June 19, 2020)

On Wednesday, EUR/USD broke below the middle line on the uptrend lines fan originated from the May 29 low at 1.1081 and generated a bearish signal. The price remained below this line highlighting bull’s weakness.
Any violation of the lower line on the aforementioned fan would generate an additional bearish signal while any break above the downtrend line originated from the June 10 high at 1.1422 would generate a bullish signal.
Therefore, a break below 1.1179 could send EURUSD towards 1.1107 on the other hand, any break above 1.1268 could trigger a rally towards 1.1343. Nonetheless, the daily support and resistance marked on the four-hour chart should be considered.

Written By: Mahmoud Alkudsi, Market Analyst
Please feel free to contact me on Twitter: @Malkudsi


