


Euro vs US Dollar Technical Outlook
- Bears are in charge
- Key levels and trading zones to keep in focus
Edging Lower
On April 14, EUR/USD rallied to its highest level in two weeks at 1.0991. However, the price retreated after the buying pressure eased. On Friday, the weekly candlestick closed in the red with a 0.5% loss.
This week, the Relative Strength Index (RSI) fell from 46 to 38 highlighting acceleration in downtrend momentum.
EUR/USD DAILY PRICE CHART (July 15, 2018 – April 24, 2020) Zoomed Out


EUR/USD DAILY PRICE CHART ( FEB 26 – April 24, 2020) Zoomed IN
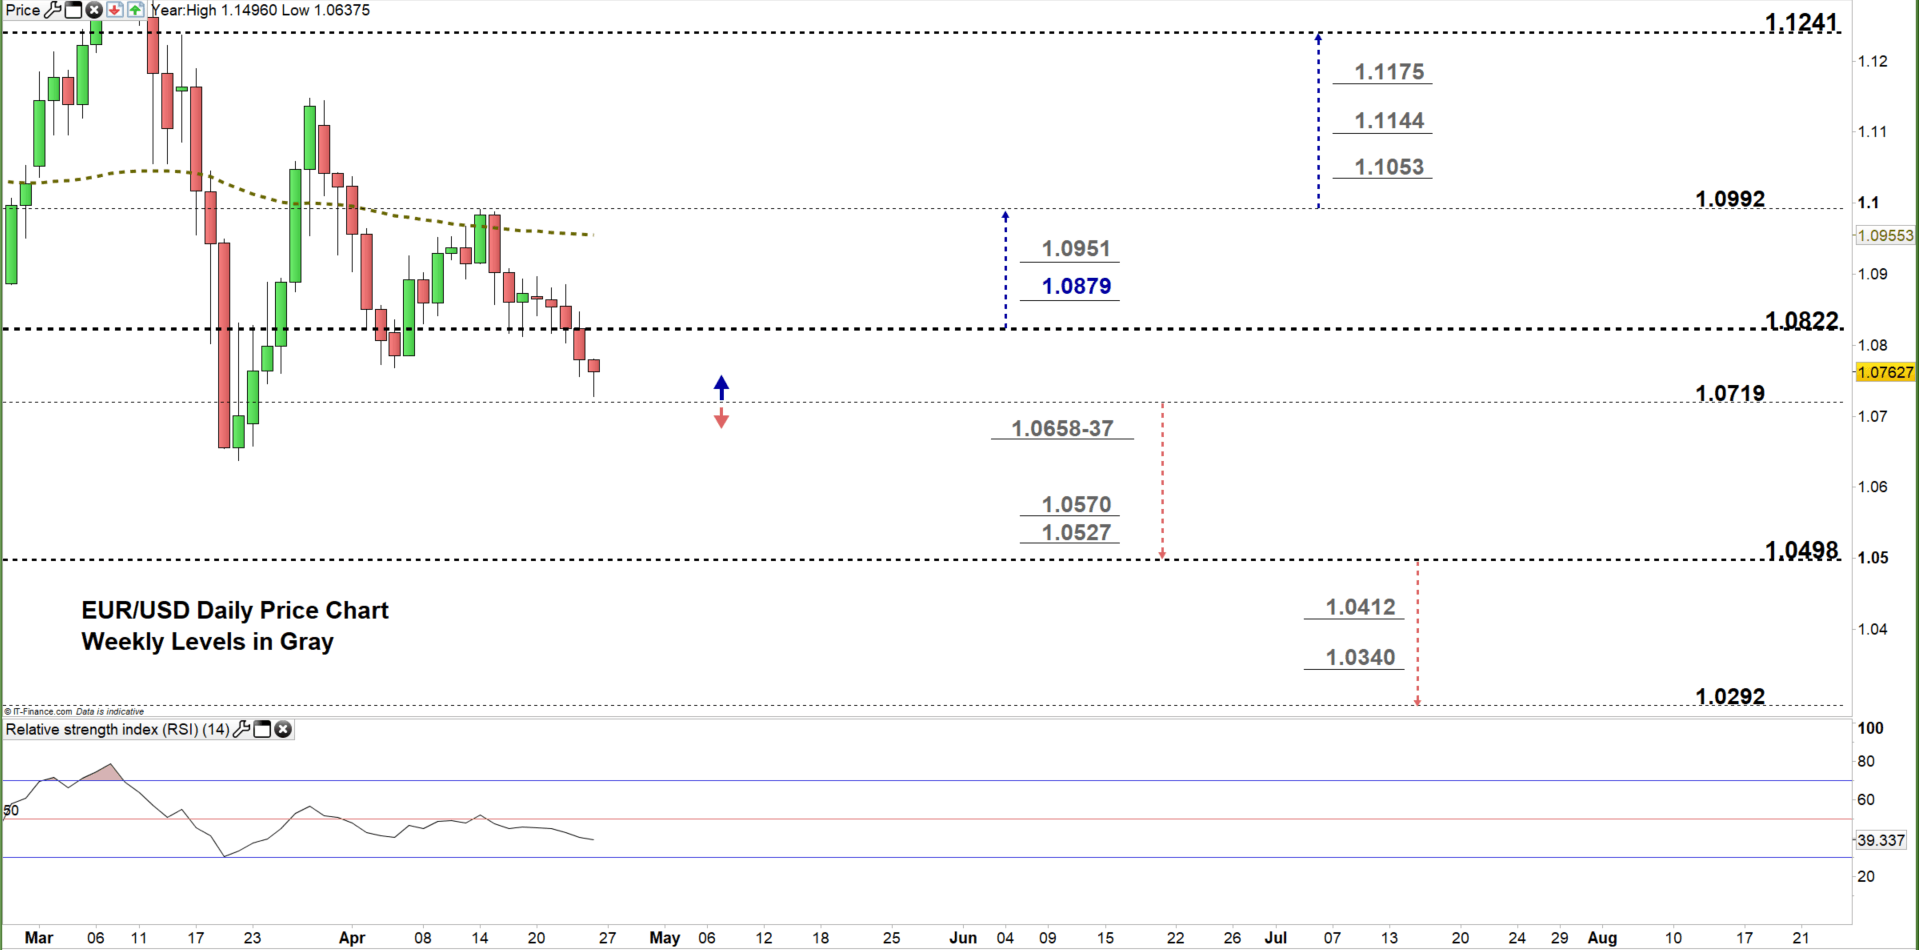
Looking at the daily chart, I noticed that on April 15 EUR/USD declined then closed below the 50-day average generating a bearish signal. Yesterday, the price fell to the current trading zone 1.0719 – 1.0822 providing an additional bearish signal.
A close below the low end of the zone may encourage bears to press towards 1.0498. Further close below that level could send the price even lower towards 1.0292. That said, the weekly support area and levels marked on the chart should be watched closely.
On the flip side, ay close above the high end of the zone could reverse the pair’s direction towards 1.0992. Further close above that level opens the door for EURUSD to trade higher and possibly rally towards 1.1241. Nevertheless, the daily and weekly resistance levels underscored on the chart should be considered.

EUR/USD Four-Hour PRICE CHART (April 6 – April 24, 2020)
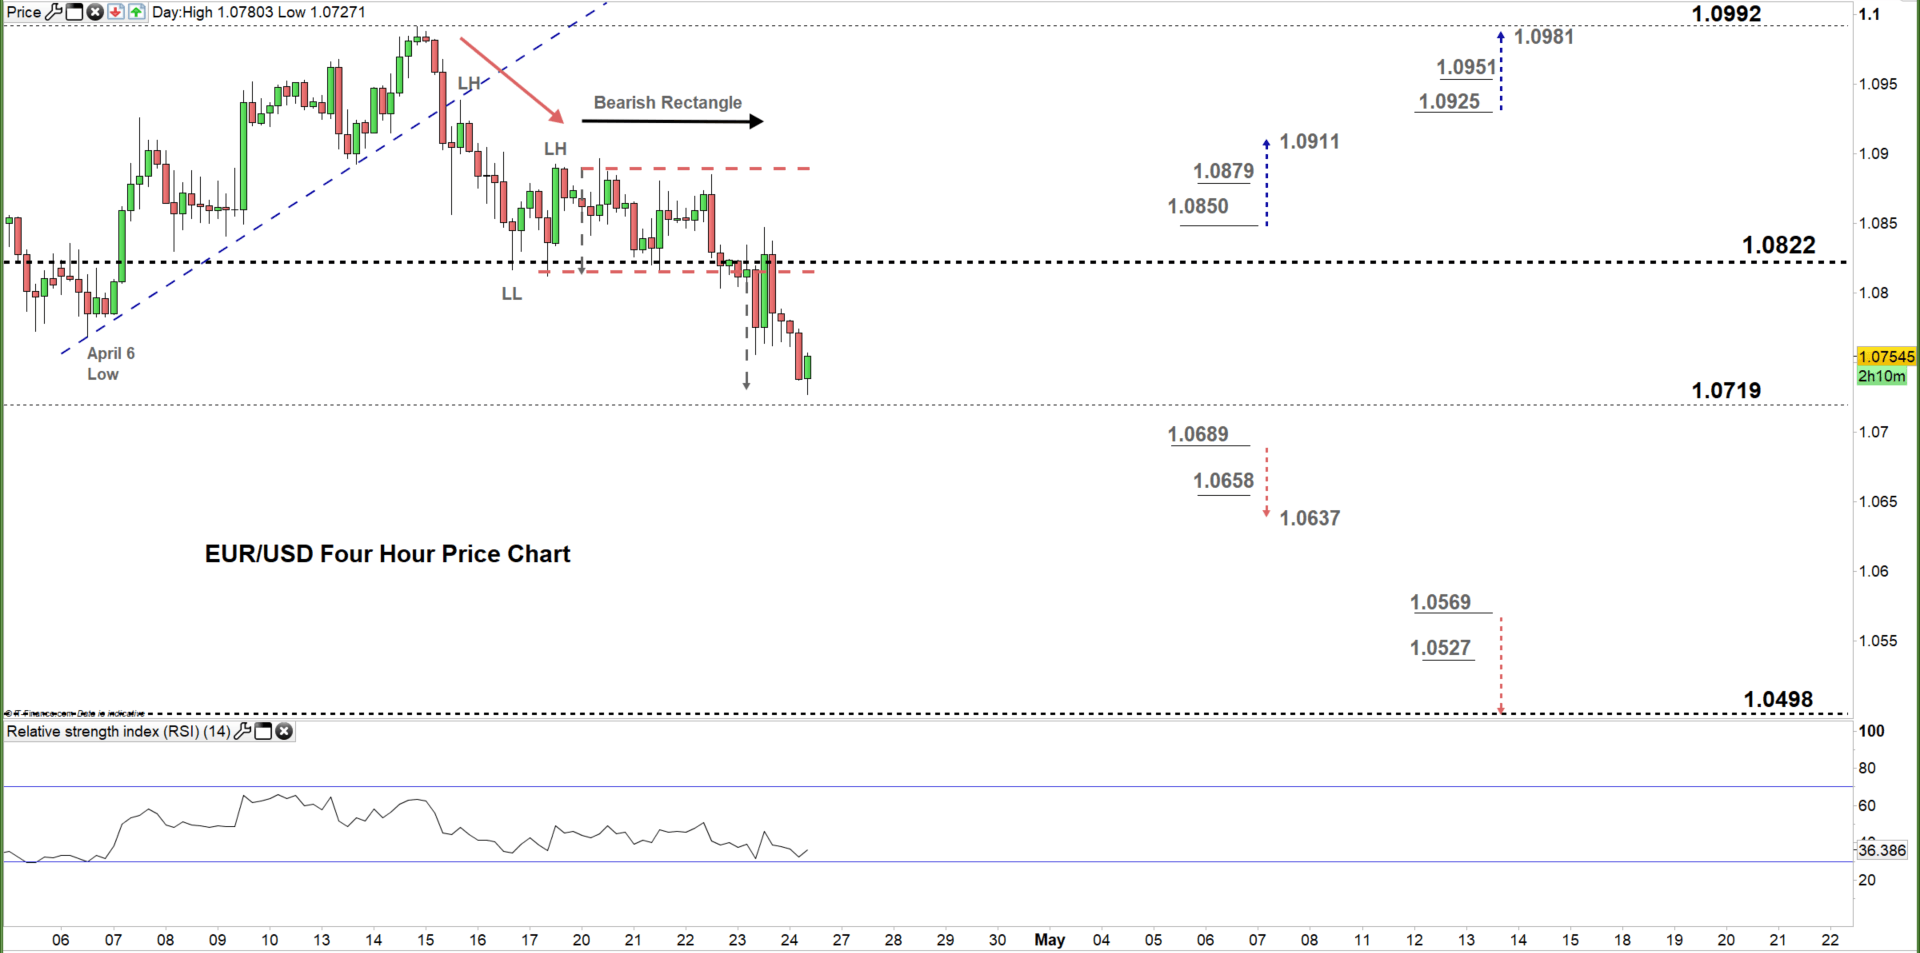
From the four- hour chart, I noticed that on April 15 EUR/USD broke below the uptrend line originated from the April 6 low at 1.0768. The price started a downtrend creating lower highs with lower lows then paused this move and developed a bearish rectangle. Yesterday, the price violated the lower line of this pattern eyeing a test of the current trading zone discussed above on the daily chart.
A break below 1.0689 could send EURUSD towards 1.0637. Yet, the weekly support level underlined on the chart should be kept in focus. In turn, any break in the other direction i.e. above 1.0850 may cause a rally towards 1.0911. Although, the daily resistance level printed on the chart should be monitored.
See the chart to find out more about key levels EUR/USD would encounter in a further bearish /bullish scenario.

Written By: Mahmoud Alkudsi, Market Analyst
Please feel free to contact me on Twitter: @Malkudsi


