


EUR/USD Technical Analysis
- Signals of a possible reversal
- Levels and thresholds to consider
EUR/USD – Trading Lower
On Friday, Euro lost more value against US Dollar and declined to its lowest level in nearly three years at 1.0637 then rallied after as some bears seemed to cover. Yet, the weekly candlestick closed in the red with 3.6% loss.
The Relative Strength Index (RSI) crossed below 50 then fell to 31 highlighting the bearish outlook of the market.
EUR/USD Daily PRice CHART (NOV 1, 2018 – Mar 23, 2020) Zoomed Out


EUR/USD Daily Price CHART (JAN 20 – MAR 23, 2020) Zoomed in
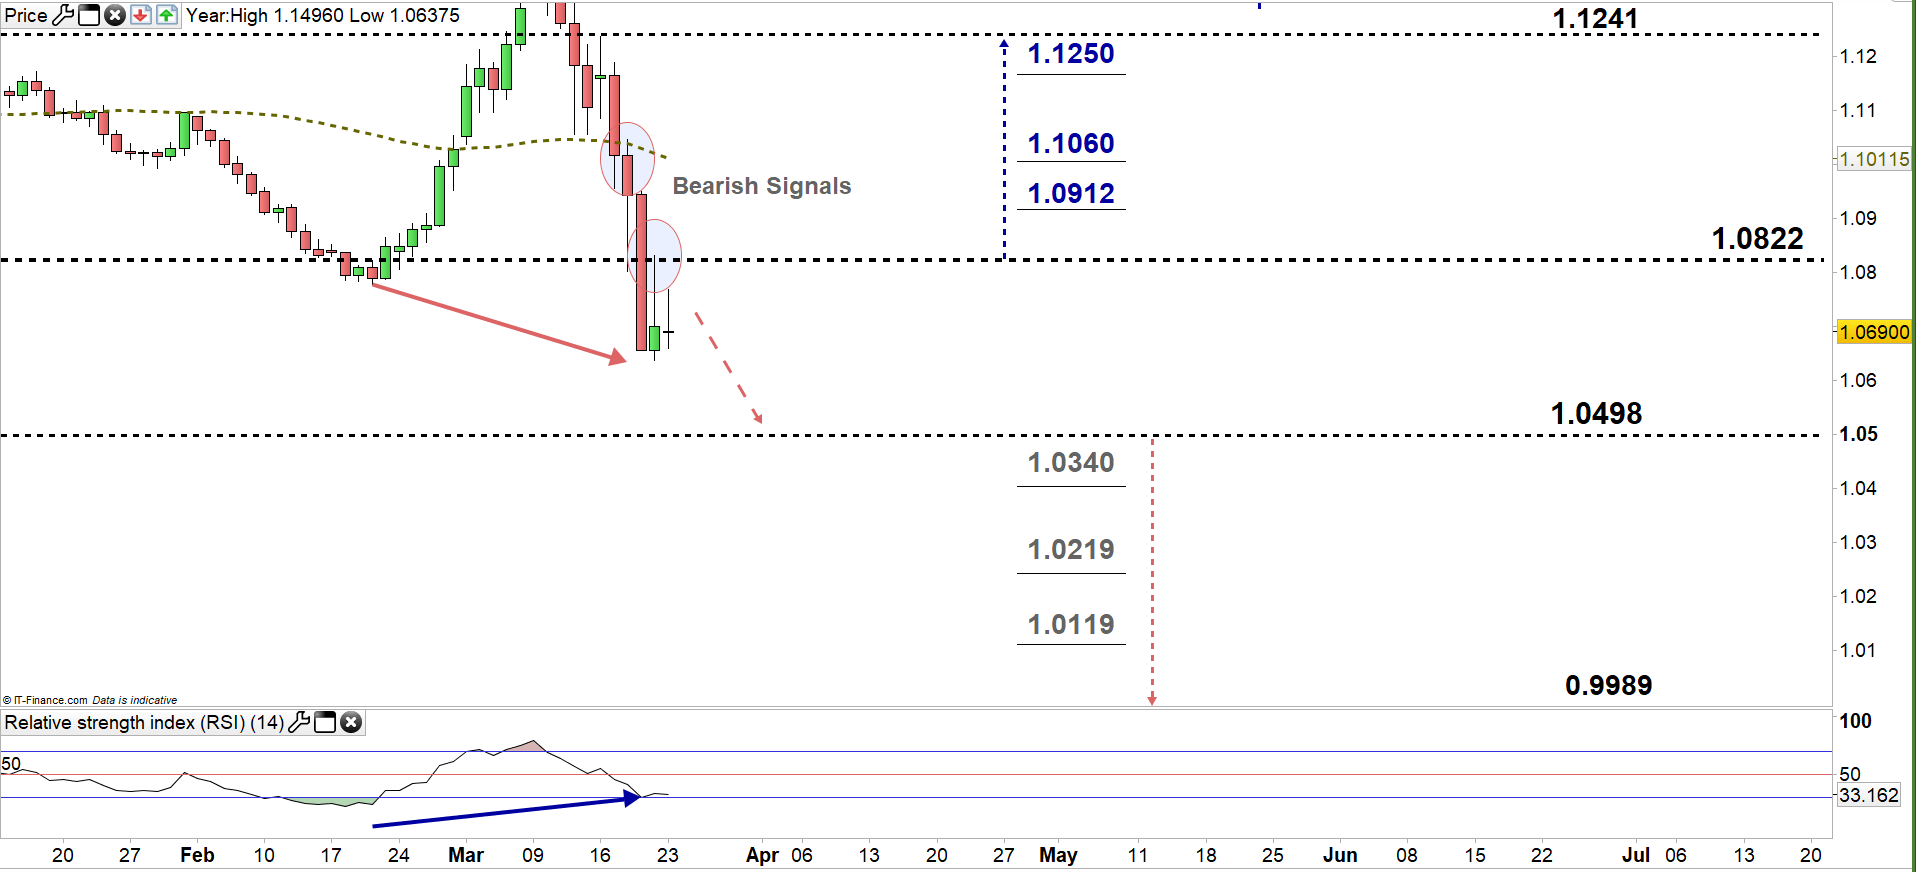
Looking at the daily chart, we noticed that on Tuesday EUR/USD fell then closed below the 50-day average generating a clear bearish signal. Later on, the pair slipped to the lower trading zone 1.0498 – 1.0822 and failed on Friday to rally to the higher zone.
That said, we spotted a bullish divergence between the price and RSI, as the first created a low and lower low meanwhile the latter created a low with higher low indicating to a possible reversal. Therefore, any failure in closing below the low end of the zone might reverse the pair’s course towards the high end . Further close above that level reflects weaker bearish momentum. This could correct EURUSD higher towards 1.1241. In that scenario, the daily resistance levels marked on the chart should be considered.
In turn, a close below the low end of the zone may encourage bears to press towards 0.9989. Although, a special attention should be paid to the weekly support levels underlined on the chart (zoomed in) as some traders could exit/join the market around these points.

EUR/USD four Hour Price CHART (MAR 10 – Mar 23, 2020)

From the four-hour chart, we noticed that at the start of last week EUR/USD paused its downtrend move and created a higher high at 1.1236. However, in the following days the market resumed bearish price action then rebounded twice developing a possible double bottom (reversal pattern). Thus, any break above the neckline located at 1.0831 could send the price towards 1.1000 handle.
Thus, a break above 1.0731 could provide bullish signal and cause a rally towards 1.0980. Yet, the daily resistance level underscored on the chart should be watched closely. On the other hand, any break below 1.0622 could mean more bearishness towards 1.0520. Nevertheless, the weekly support level printed on the chart should be kept in focus.
See the chart to know more about key technical levels in a further bullish/bearish scenario.

Written By: Mahmoud Alkudsi
Please feel free to contact me on Twitter: @Malkudsi


