


EUR/USD Price Technical Outlook
- Will EUR/USD resume bearish price action?
- Levels and trading zones to konw
EUR/USD Price – Bears Hold Fire
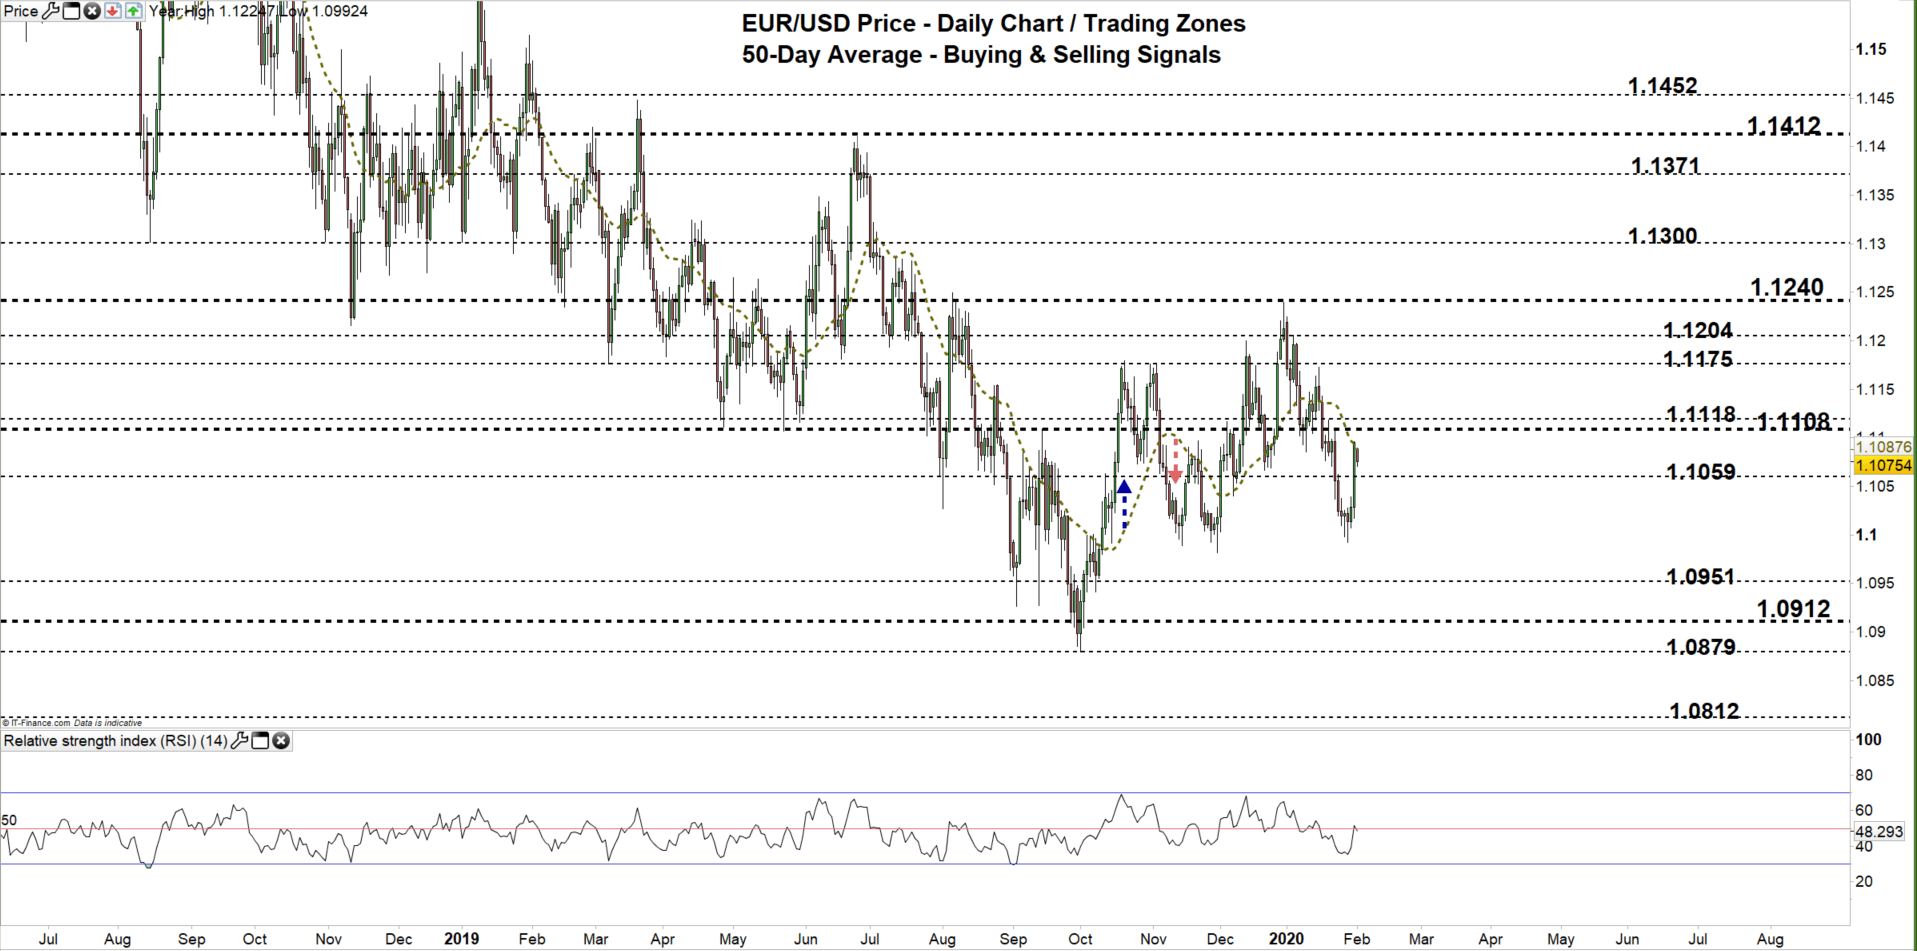
Last week, EUR/USD tumbled to 1.0992- its lowest level in two months. However, the market rallied following this plunge as some shorts seemed to cover. On Friday, the weekly candlestick closed in the green for the first time in five weeks with 0.6% gain.
Alongside that, the Relative Strength Index (RSI) rose from 35 to 51 highlighting weak sellers in a bearish market.
EUR/USD Daily PRice CHART (June 15, 2018 – FEB 3, 2020) Zoomed Out

EUR/USD Daily Price CHART (Sep 25 – FEB 3, 2020) Zoomed in
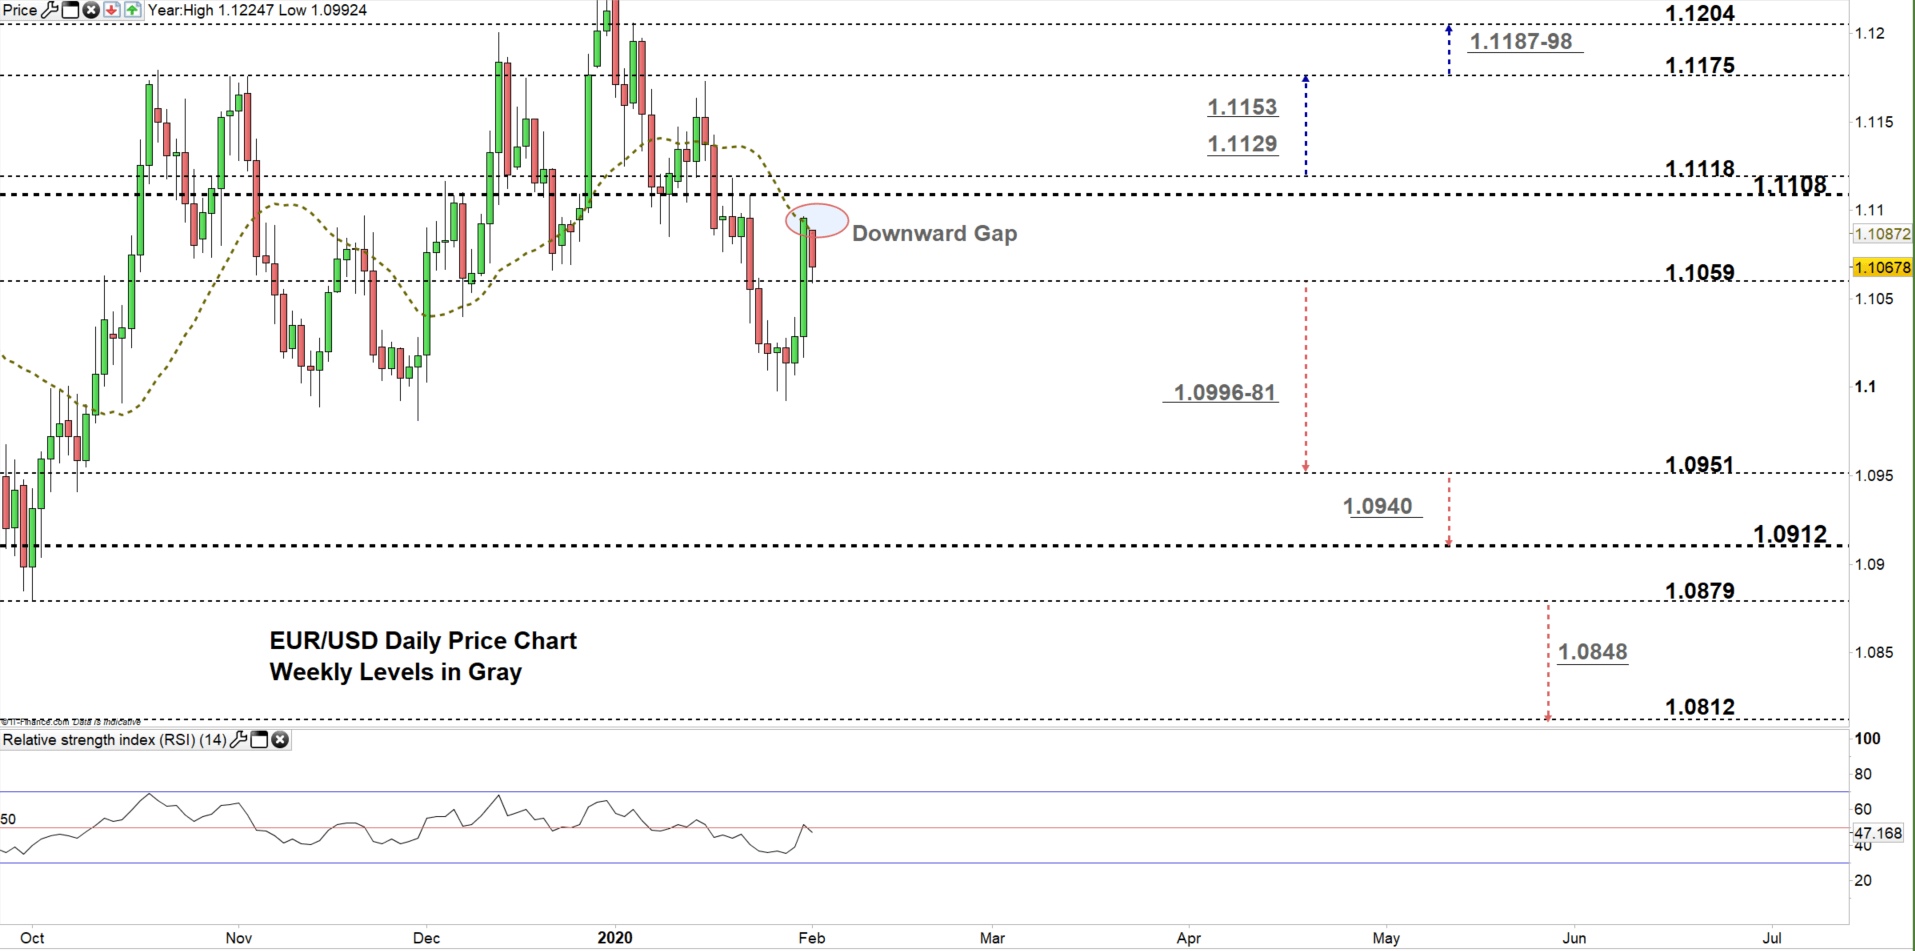
Looking at the daily chart, we notice on Friday EUR/USD surged to a higher trading zone 1.1059 – 1.1108 then closed above the 50-day average generating two bullish signals. However, the market opened this week with a gap to the downside signaling that bears may comeback.
A close below the low end of the zone could embolden bears to reattempt pressing EURUSD towards 1.0951. Further close below this level could convince them to continue bearish price action towards 1.0912. Having said that, the weekly support zone and level marked on the chart (zoomed in) should be considered as some traders may join/exit around these points.
In turn, any failure to close below the low end reflects bears hesitation. This could lead some of them to exit the market and reverse the pair’s direction towards the high end of the zone. Further close above 1.1118 opens the door for bulls to take charge and possibly push towards 1.1175. Yet, the weekly resistance levels underscored on the chart would be worth monitoring.

EUR/USD four Hour Price CHART (DEC 16 – FEB 3, 2020)

From the four-hour chart, we noticed that on Jan 31 EUR/USD broke above the downtrend line originated from the Jan 16 high at 1.1172. The price remained above this and printed 1.1096 – its highest level in a week..
A break below 1.1039 could send EURUSD towards 1.0996. Although, the Jan 31 low at 1.1017 should be watched closely. On the flip side, any rally above 1.1129 may lead EURUSD towards 1.1162. Yet, the weekly resistance level underlined on the chary should be kept in focus.
See the chart to know more about key technical levels in a further bullish/bearish scenario.
Written By: Mahmoud Alkudsi
Please feel free to contact me on Twitter: @Malkudsi


