


EUR/USD TECHNICAL ANALYSIS: BEARISH
- Euro grinding through 4-month trend support, eyeing breakdown
- Confirmation may set the stage for a drop toward the 1.07 figure
- Near-term chart hints bounce may precede bearish progression
The Euro is inching closer toward a break downward against the US Dollar. The exchange rate is grinding through support in the 1.1069-1.1104 area, a price congestion area bolstered by upward-sloping support defining the upswing from the October 1 swing low.
Confirmation of a breach on a daily closing basis initially exposes the 1.0968-90 inflection zone, followed by the four-month low at 1.0879. A bounce form here sees minor resistance at 1.1149 but a true test of buyers’ mettle probably requires a challenge of the December 31 peak at 1.1239.

EUR/USD daily chart created with TradingView
The weekly chart offers a sense of what downtrend resumption might ultimately look like. Trading dynamics of the descent in play since mid-2018 point to an average downswing of 4.6 percent. Such a move would put the single currency just above the 1.07 figure, amounting to the lowest level since April 2017.
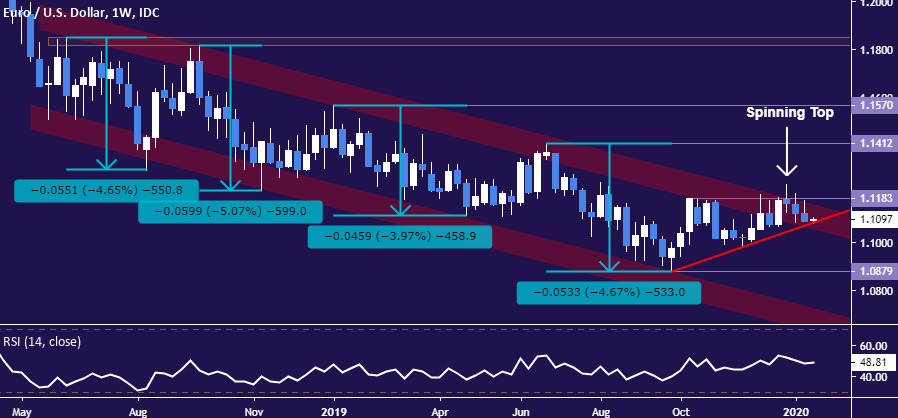
EUR/USD weekly chart created with TradingView

Zooming in to the four-hour chart for a look at more immediate positioning warns against over-extrapolating bearish follow-through just yet. First and foremost, prices have yet to break support. Until that occurs, traders may judge building out short exposure as unattractive from a risk/reward perspective.
Furthermore, signs of positive RSI divergence have emerged. That points to ebbing downward momentum that might precede a bounce. If any such move manages to breach falling resistance in play since the calendar turned to 2020 – now at 1.1157 – immediate selling pressure will appear to have been neutralized.

EUR/USD 4-hour chart created with TradingView
EUR/USD TRADER SENTIMENT
| Change in | Longs | Shorts | OI |
| Daily | -1% | -4% | -3% |
| Weekly | 4% | -10% | -5% |
EUR/USD TRADING RESOURCES
- Just getting started? See our beginners’ guide for FX traders
- Having trouble with your strategy? Here’s the #1 mistake that traders make
- Join a free webinar and have your questions answered
--- Written by Ilya Spivak, Currency Strategist for DailyFX.com
To contact Ilya, use the comments section below or @IlyaSpivak on Twitter


