


EUR/USD Technical Outlook
- EUR price action against USD
- EUR/USD chart and analysis

EUR/USD – Neutral Outlook
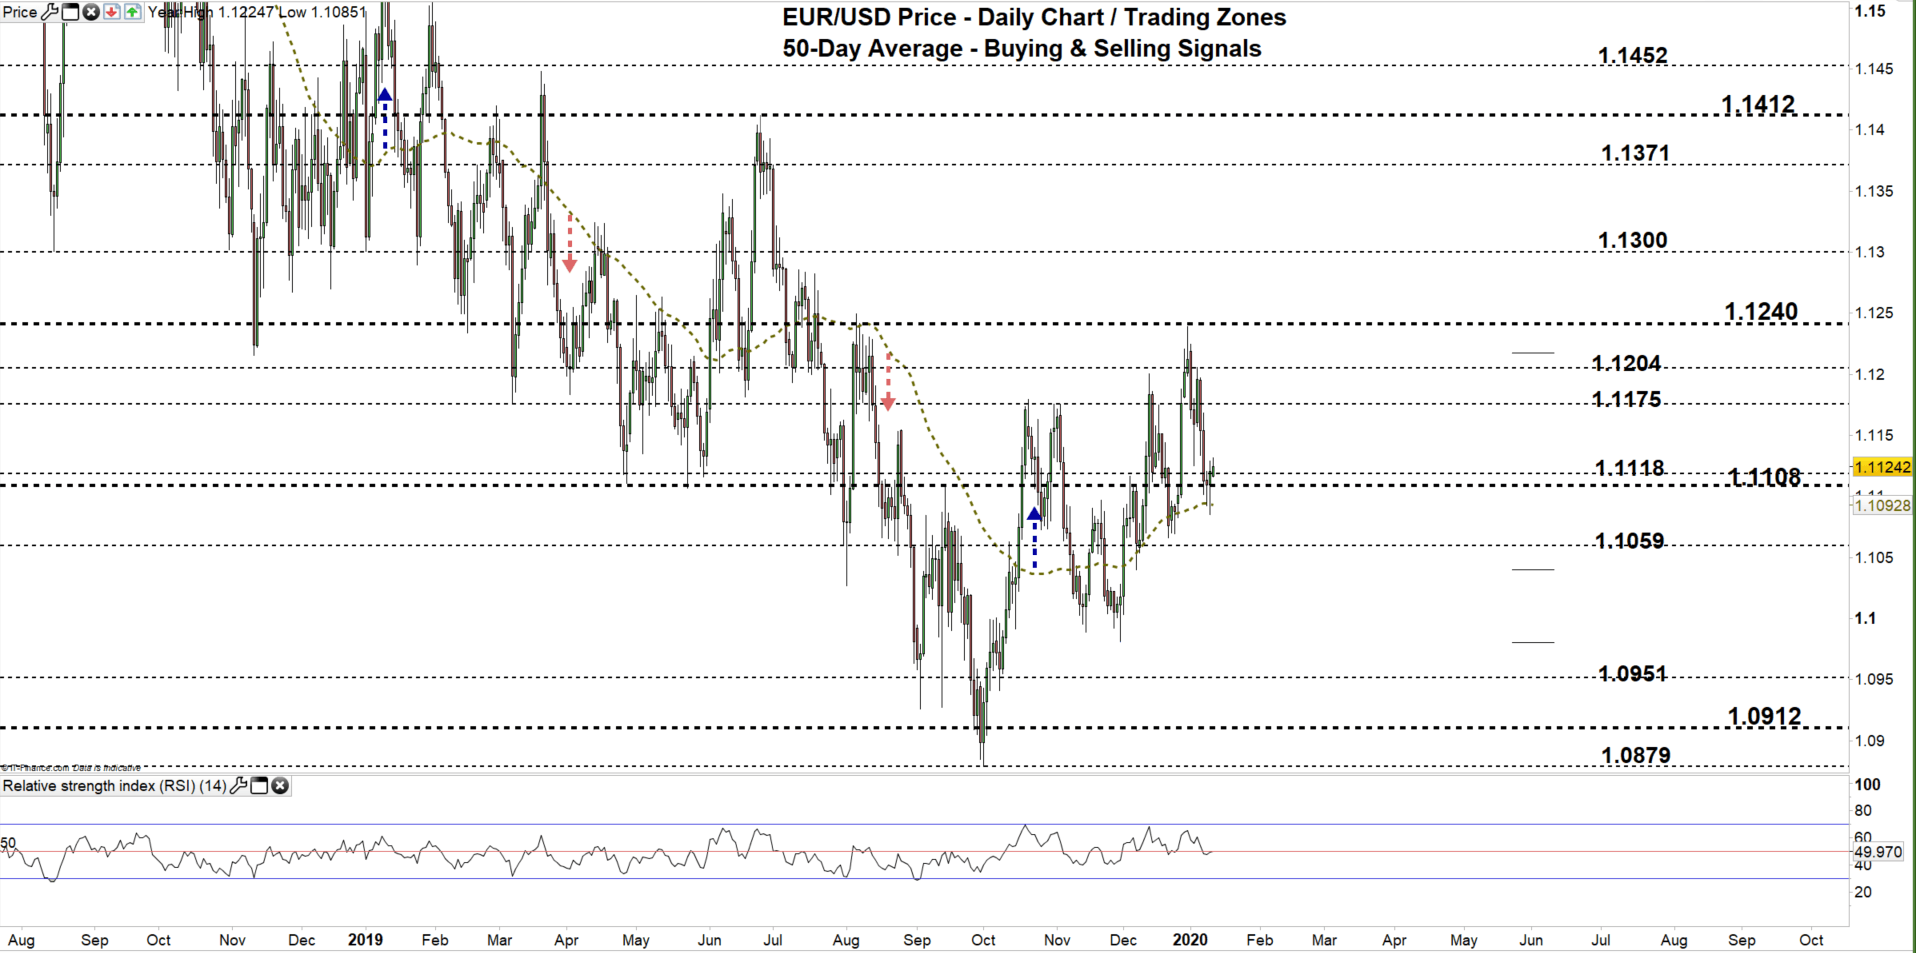
On the last day of 2019, rallied EUR/USD to its highest level in nearly five months at 1.1239. However, the price declined after as some buyers took profit. On Friday, the price closed the weekly candlestick in the red with a 0.3% loss.
The Relative Strength Index (RSI) created a high with a lower high meanwhile the price created a high with a higher high with higher signalling a bearish divergence i.e. a possible uptrend reversal. Last week, the oscillator crossed below 50 reflecting the end of uptrend momentum. However, RSI remained flat after highlighting weak sellers and weaker buyers.
Having trouble with your trading strategy? Need a hand? Here’s the #1 Mistake That Traders Make
EUR/USD Daily PRice CHART (July 15, 2018 – Jan 13, 2020) Zoomed Out
EUR/USD Daily Price CHART (Aug 25 – Jan 13, 2020) Zoomed in

Looking at the daily chart, we notice last week, EUR/USD fell to 1.1085 – its lowest level in two weeks. Currently, the price trades in the same zone 1.1108 – 1.1175 as failed in multiple occasions to move to the lower zone signaling to the market’s indecision at this stage.
Thus, a close below the low end of the zone tips the balance towards the sellers and may encourage them to press towards 1.1059. Further close below this level opens the door for sellers to send EURUSD towards 1.0951. Although, the weekly support levels should be considered as any break to them could trigger stop loss/ take profit orders for some market participants.
On the other hand, a close above 1.1118 reflects seller’s hesitation and could reverse the pair’s direction towards the high end of the zone contingent on clearing the resistance level at 1.1153. Further close above this level could convince more buyers to join the market and push towards 1.1204.

EUR/USD four Hour Price CHART (NOV 29 – Jan 13, 2020)
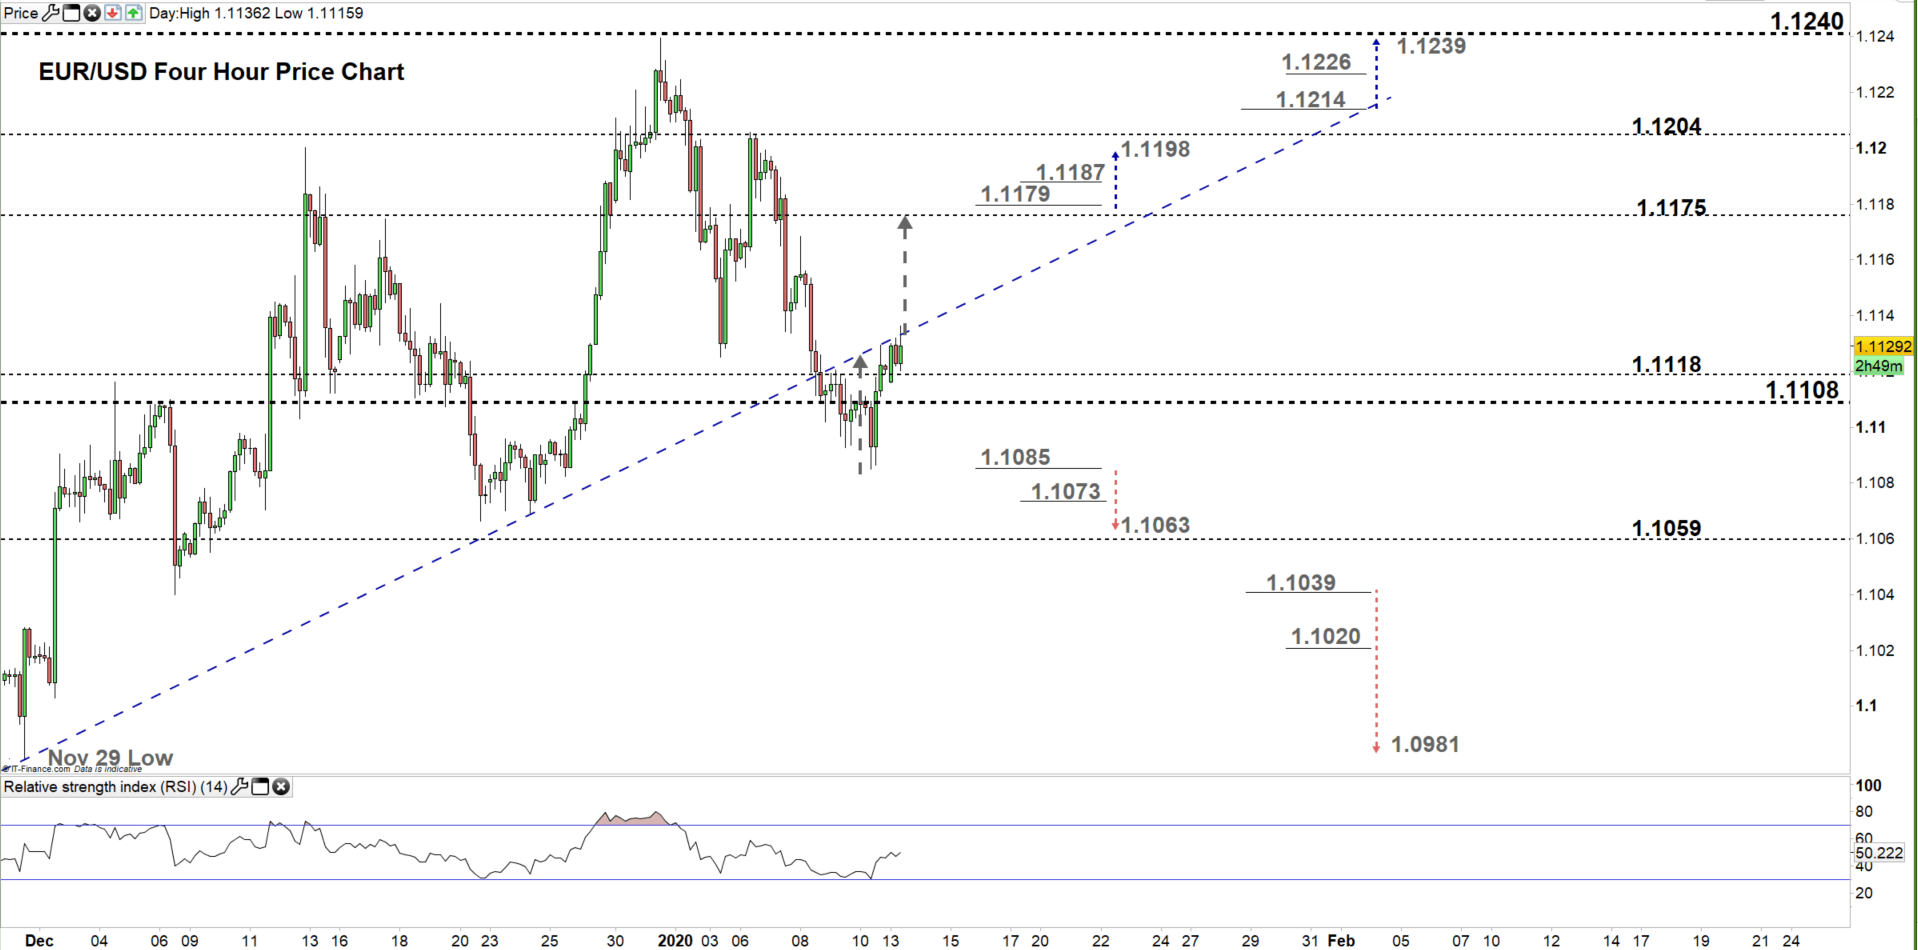
From the four-hour chart, we notice on Friday EUR/USD rebounded from the uptrend line originated from the Nov 29 low at 1.0981. A violation of this line signals a possible rally towards the high end of the zone discussed on the daily chart.
Thus, a break above 1.1179 could push EURUSD towards 1.1198. Although, the weekly resistance level underlined on the chart should be watched closely. On the other hand, a break below 1.1085 may resume bearish price action towards 1.1063. Yet, the support level underlined on the chart should be kept in focus.
Having trouble with your trading strategy? Need a hand? Here’s the #1 Mistake That Traders Make
Written By: Mahmoud Alkudsi
Please feel free to contact me on Twitter: @Malkudsi


